Date oficiale · National Institute of Statistics (INS)
The average pension in Romania
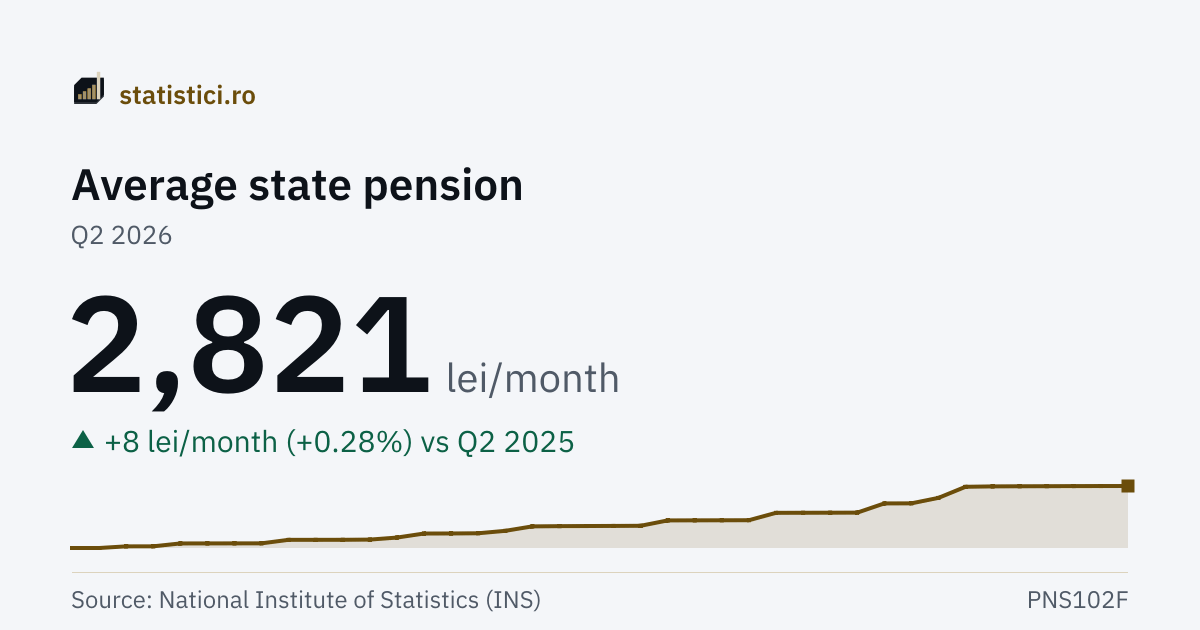
The average monthly pension, quarter by quarter, computed by the National Institute of Statistics from the amounts due to the pensioners on the payroll.
State social insurance pension
2,821 lei/month
Q2 2026
The average of all pensioners
2,942 lei/month
Q2 2026
The “State social insurance pension” series
- Series high
- 2,821 lei/monthQ2 2026
- Series low
- 260 lei/monthQ1 2005
- Quarters published
- 86since Q1 2005
Trends
Take this chart
You may use the PNG image or the embedded chart (iframe) on your own site. The iframe updates itself when new data arrive. The attribution and the link to the source are included automatically.
How many pensioners there are
The average number of pensioners, obtained by adding up the pensioners on the payroll in each month and dividing by the number of months. It is the denominator the average pension above is computed from. The “state” row begins only in 2013: INS does not publish the breakdown by scheme before that year.
State social insurance pensioners
4,572,711 people
Q2 2026
All pensioners
4,912,654 people
Q2 2026
| Period | State social insurance pensioners | All pensioners |
|---|---|---|
| Q2 2026 | 4,572,711 | 4,912,654 |
| Q1 2026 | 4,577,202 | 4,920,043 |
| Q4 2025 | 4,577,860 | 4,927,441 |
| Q3 2025 | 4,569,184 | 4,920,905 |
| Q2 2025 | 4,562,418 | 4,918,103 |
| Q1 2025 | 4,542,596 | 4,900,495 |
| Q4 2024 | 4,561,179 | 4,923,747 |
| Q3 2024 | 4,597,171 | 4,964,953 |
| Q2 2024 | 4,598,944 | 4,971,008 |
| Q1 2024 | 4,602,156 | 4,977,038 |
| Q4 2023 | 4,606,325 | 4,980,941 |
| Q3 2023 | 4,601,117 | 4,979,099 |
What it means
The average monthly pension is computed by dividing the amounts due to the pensioners on the payroll by their average monthly number multiplied by twelve. It is not the pension any particular pensioner receives, nor the “typical” pension: it is an arithmetic mean, which the large pensions pull upwards.
The headline figure is the state social insurance pension, the scheme the great majority of pensioners are in. The average of all pensioners additionally covers other schemes and categories — military pensions among them — as well as the recipients of pension-type social aid and those in the I.O.V.R. category.
The two figures cross over time, and that shows how much it matters which of them is read. In the first quarter of 2005 the average of all pensioners was below the state one, because there were still some 1.5 million farmer pensioners on small pensions. Today it is above it. This is not merely a difference of level, but a difference in the shape of the history.
The amounts due have changed their content several times by law: from January 1999 they include the supplementary pension and the health insurance contribution, from July 2000 also the tax on the amounts above the ceiling, and from January 2003 they no longer include the health contribution. Comparisons over long spans cross these changes.
History
| Period | State social insurance pension | The average of all pensioners |
|---|---|---|
| Q2 2026 | 2,821 | 2,942 |
| Q1 2026 | 2,820 | 2,934 |
| Q4 2025 | 2,818 | 2,957 |
| Q3 2025 | 2,815 | 2,941 |
| Q2 2025 | 2,813 | 2,932 |
| Q1 2025 | 2,809 | 2,916 |
| Q4 2024 | 2,797 | 2,898 |
| Q3 2024 | 2,459 | 2,582 |
| Q2 2024 | 2,292 | 2,427 |
| Q1 2024 | 2,290 | 2,418 |
| Q4 2023 | 2,009 | 2,125 |
| Q3 2023 | 2,007 | 2,117 |
| Q2 2023 | 2,005 | 2,108 |
| Q1 2023 | 2,003 | 2,101 |
| Q4 2022 | 1,778 | 1,866 |
| Q3 2022 | 1,776 | 1,856 |
| Q2 2022 | 1,774 | 1,851 |
| Q1 2022 | 1,772 | 1,846 |
| Q4 2021 | 1,608 | 1,679 |
| Q3 2021 | 1,604 | 1,673 |
| Q2 2021 | 1,601 | 1,661 |
| Q1 2021 | 1,597 | 1,650 |
| Q4 2020 | 1,590 | 1,636 |
| Q3 2020 | 1,454 | 1,505 |
Year by year
Every year has its own page, with all its periods, the average, the minimum and the maximum.
2026 2025 2024 2023 2022 2021 2020 2019 2018 2017 2016 2015 2014 2013 2012 2011 2010 2009 2008 2007 2006 2005
Source: National Institute of Statistics (INS), matrices PNS101F, PNS102F. Period covered: Q1 1996 – Q2 2026. See the source.
The series begins in the first quarter of 2005, the first period for which INS publishes the amounts in denominated lei; before that the same rows are expressed in old lei. The data are quarterly and are published some three months after the quarter closes, so this page is normally further behind than the monthly figures on the site.