Date oficiale · National Institute of Statistics (INS)
Building permits
How many building permits for residential buildings were issued each month, for the whole country and by county.
Permits for residential buildings
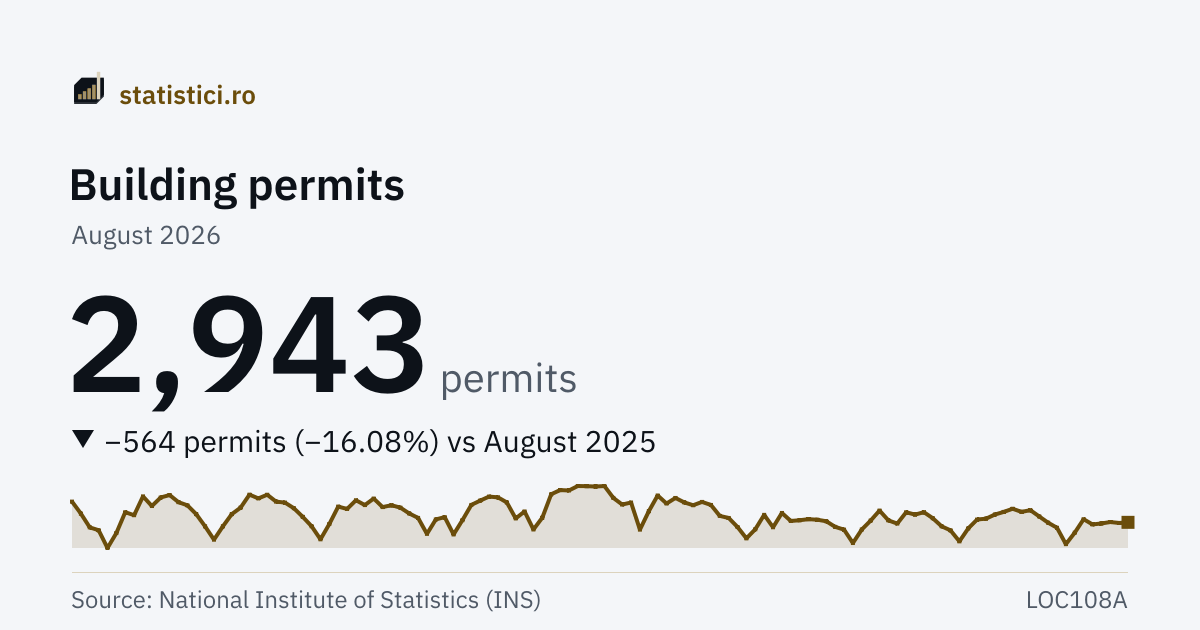
2,943 permits
August 2026
The “Permits for residential buildings” series
- Series high
- 6,291 permitsMay 2008
- Series low
- 770 permitsJanuary 2003
- Months published
- 296since January 2002
Trends
Take this chart
You may use the PNG image or the embedded chart (iframe) on your own site. The iframe updates itself when new data arrive. The attribution and the link to the source are included automatically.
Building permits
The number of permits for every type of building: residential, residential for communities, administrative and the rest — hotels, retail and others. It is larger than the figure above, which counts residential buildings only: in June 2026, 3,517 against 2,960. These are permits for BUILDINGS, not dwellings; in the same month INS publishes, in another matrix, 9,190 authorised dwellings, and the two figures are not to be compared.
Permits for all types of building
3,512 permits
August 2026
Derived figure. INS publishes no total across types of building in any of the 1,916 Tempo matrices, so this figure is our sum over the categories it does publish. It can be checked: the same matrix also holds one annual value per category, and the twelve months of each year add up exactly to it — all 130 year × category pairs that have data match, not one is out. That is also where reading a missing cell as zero comes from: in the five years in which a category has a month without a figure, the published months still give exactly the annual value. For 2026 there is no annual value yet, so the two recent months without a figure are read as zero by analogy with the earlier years, not verified. From January 2009 INS publishes “other buildings” split into its three components; the total covers the same types of building both before and after, but it could NOT be checked figure by figure that the three components reproduce the old aggregate, because INS publishes the aggregate only up to December 2008 and the components only from January 2009 — no month and no year contains both.
| Period | Permits for all types of building |
|---|---|
| August 2026 | 3,512 |
| July 2026 | 3,486 |
| June 2026 | 3,517 |
| May 2026 | 3,467 |
| April 2026 | 3,382 |
| March 2026 | 3,645 |
| February 2026 | 2,876 |
| January 2026 | 2,147 |
| December 2025 | 3,195 |
| November 2025 | 3,484 |
| October 2025 | 3,928 |
| September 2025 | 4,208 |
All types of building
The total usable floor area, in square metres, authorised by those same permits. It says something different from their number: a month with fewer permits can authorise more square metres, if the buildings going up are larger.
Usable floor area authorised
721,726 permits
August 2026
| Period | Usable floor area authorised |
|---|---|
| August 2026 | 721,726 |
| July 2026 | 712,682 |
| June 2026 | 975,756 |
| May 2026 | 825,798 |
| April 2026 | 854,061 |
| March 2026 | 713,450 |
| February 2026 | 653,685 |
| January 2026 | 532,378 |
| December 2025 | 894,770 |
| November 2025 | 879,030 |
| October 2025 | 836,435 |
| September 2025 | 1,010,660 |
What it means
A building permit is the act of the local administration on the basis of which the legal rules on the siting, design, execution and operation of constructions are applied. It is issued to the beneficiary of the works, in accordance with the urban planning documents, with a view to the START of the works.
The statistical survey is monthly and has run since 2002. The forms are filled in by the prefectures and by the county and local councils, the Bucharest districts included. The figures refer to the permits issued for buildings, as well as to extensions to existing residential buildings.
The series is strongly seasonal: the average January over the whole period is some 1,800 permits and the average August some 4,200 — more than twice as many. The change against the previous month says almost nothing about the market; the useful comparison is with the same month of the previous year.
INS revises months published years earlier: January 2020 is marked “revised” in the national series. Each import reads the whole window again, not only the last few months.
Permits by county
The number of permits for residential buildings issued in each county, the same measure as the national figure above and from the same matrix.
The page has figures for 42 counties of 42. Added up, the 42 counties give 2,943 permits in August 2026, against 2,943 permits for the country as a whole. The figures match exactly.
| # | county | permits |
|---|---|---|
| 1 | Ilfov | 237 |
| 2 | Timiș | 203 |
| 3 | Iași | 197 |
| 4 | Suceava | 160 |
| 5 | Constanța | 128 |
| 6 | Argeș | 123 |
| 7 | Bihor | 122 |
| 8 | Cluj | 112 |
| 9 | Brașov | 97 |
| 10 | Prahova | 89 |
| 11 | Maramureș | 86 |
| 12 | Arad | 82 |
| 12 | Dâmbovița | 82 |
| 14 | Neamț | 80 |
| 15 | Galați | 72 |
| 16 | Bacău | 69 |
| 17 | Dolj | 65 |
| 18 | Bistrița-Năsăud | 60 |
| 18 | Sibiu | 60 |
| 20 | Vrancea | 59 |
| 21 | Buzău | 56 |
| 22 | Giurgiu | 52 |
| 23 | Vâlcea | 51 |
| 24 | Sălaj | 49 |
| 25 | Gorj | 45 |
| 26 | Alba | 44 |
| 26 | Botoșani | 44 |
| 26 | Harghita | 44 |
| 29 | Ialomița | 42 |
| 30 | Mehedinți | 41 |
| 31 | Satu Mare | 40 |
| 32 | Mureș | 35 |
| 32 | Olt | 35 |
| 34 | Călărași | 33 |
| 35 | Bucharest Municipality | 24 |
| 36 | Hunedoara | 23 |
| 37 | Vaslui | 22 |
| 38 | Brăila | 21 |
| 39 | Covasna | 20 |
| 40 | Tulcea | 17 |
| 41 | Teleorman | 12 |
| 42 | Caraș-Severin | 10 |
History
| Period | Permits for residential buildings |
|---|---|
| August 2026 | 2,943 |
| July 2026 | 2,909 |
| June 2026 | 2,960 |
| May 2026 | 2,882 |
| April 2026 | 2,831 |
| March 2026 | 3,112 |
| February 2026 | 2,386 |
| January 2026 | 1,768 |
| December 2025 | 2,650 |
| November 2025 | 2,924 |
| October 2025 | 3,259 |
| September 2025 | 3,598 |
| August 2025 | 3,507 |
| July 2025 | 3,675 |
| June 2025 | 3,505 |
| May 2025 | 3,364 |
| April 2025 | 3,140 |
| March 2025 | 3,095 |
| February 2025 | 2,617 |
| January 2025 | 1,918 |
| December 2024 | 2,511 |
| November 2024 | 2,729 |
| October 2024 | 3,165 |
| September 2024 | 3,490 |
Year by year
Every year has its own page, with all its periods, the average, the minimum and the maximum.
2026 2025 2024 2023 2022 2021 2020 2019 2018 2017 2016 2015 2014 2013 2012 2011 2010 2009 2008 2007 2006 2005 2004 2003 2002
Source: National Institute of Statistics (INS), matrix LOC108A. Period covered: January 2002 – August 2026. See the source.
The series is for residential buildings, excluding those for communities — the only row INS publishes unbroken across all 295 months, without a single missing cell. The series is strongly seasonal and INS publishes no seasonally adjusted variant for the number of permits, so the comparison that says something is the one with the same month of the previous year, not with the month before.