Date oficiale · National Institute of Statistics (INS)
Education in Romania
How many children, pupils and students are in the education system, school year by school year, and how many leave it before finishing.
School population (the 2014/2015 definition)
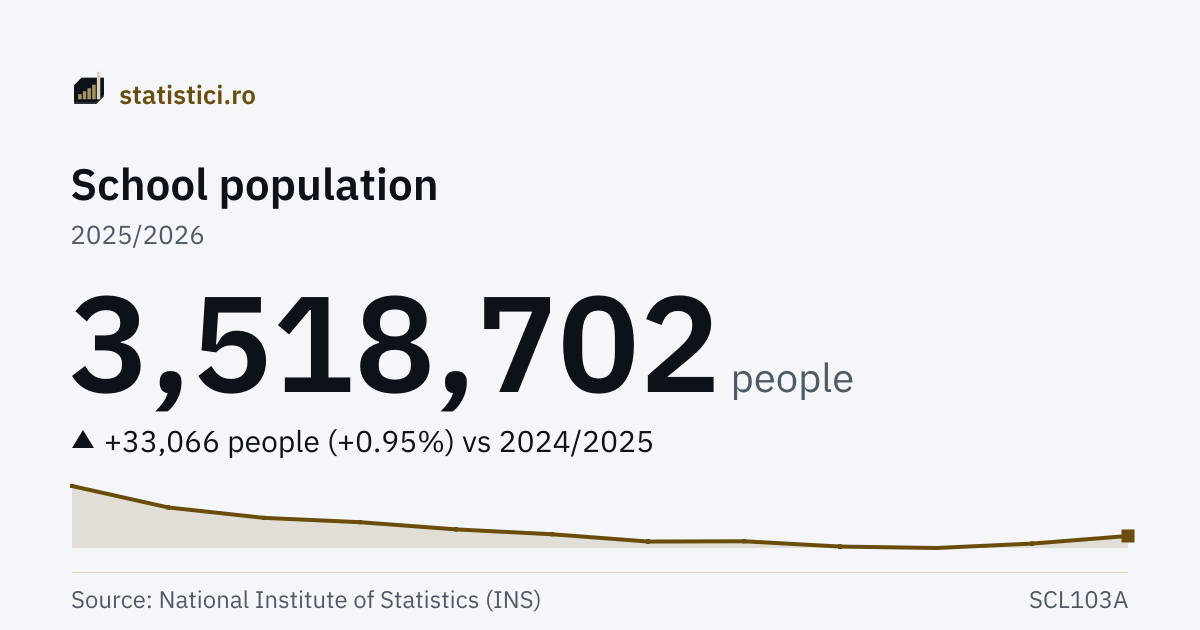
3,518,702 people
2025/2026
School population (the definition up to 2013/2014)
3,650,933 people
2013/2014
The “School population (the 2014/2015 definition)” series
- Series high
- 3,735,552 people2014/2015
- Series low
- 3,466,548 people2023/2024
- Years published
- 12since 2014/2015
Trends
Take this chart
You may use the PNG image or the embedded chart (iframe) on your own site. The iframe updates itself when new data arrive. The attribution and the link to the source are included automatically.
Students in higher education
The two figures do not overlap in meaning: the first covers bachelor's, master's and doctoral studies, but INS publishes it only from 2014/2015; the second covers bachelor's studies alone, yet goes back to 1990/1991. Spliced together they would produce a 32% jump in a single year, so they stay two lines. The higher-education data are by the locality of the faculty, not by the student's domicile.
Bachelor's, master's and doctoral
580,872 people
2025/2026
Bachelor's only
436,653 people
2025/2026
| Period | Bachelor's, master's and doctoral | Bachelor's only |
|---|---|---|
| 2025/2026 | 580,872 | 436,653 |
| 2024/2025 | 568,608 | 432,907 |
| 2023/2024 | 544,623 | 414,998 |
| 2022/2023 | 538,720 | 410,181 |
| 2021/2022 | 554,007 | 415,839 |
| 2020/2021 | 560,490 | 418,346 |
| 2019/2020 | 543,299 | 407,373 |
| 2018/2019 | 533,749 | 402,696 |
| 2017/2018 | 538,871 | 408,179 |
| 2016/2017 | 531,586 | 405,638 |
| 2015/2016 | 535,218 | 410,697 |
| 2014/2015 | 541,653 | 411,229 |
The school dropout rate
The difference between the number of pupils enrolled at the start of the school year and the number on the books at the end of that same year, divided by those enrolled. There is no single national dropout rate in the INS data: each level of education has its own, with a different denominator, and the three here are neither added nor averaged. Dropout in primary and lower secondary education is computed without the pupils in special education.
Primary and lower secondary
0.9 %
2024/2025
Upper secondary (academic and vocational)
0.7 %
2024/2025
Post-secondary and foreman training
6.4 %
2024/2025
| Period | Primary and lower secondary | Upper secondary (academic and vocational) | Post-secondary and foreman training |
|---|---|---|---|
| 2024/2025 | 0.9 | 0.7 | 6.4 |
| 2023/2024 | 1.0 | 0.9 | 7.6 |
| 2022/2023 | 1.2 | 1.0 | 8.0 |
| 2021/2022 | 1.2 | 2.1 | 8.7 |
| 2020/2021 | 1.2 | 1.7 | 7.1 |
| 2019/2020 | 1.3 | 2.0 | 7.5 |
| 2018/2019 | 1.6 | 2.6 | 9.7 |
| 2017/2018 | 1.7 | 2.6 | 9.2 |
| 2016/2017 | 1.6 | 2.6 | 10.0 |
| 2015/2016 | 1.8 | 3.6 | 9.7 |
| 2014/2015 | 2.0 | 3.5 | 10.7 |
| 2013/2014 | 1.5 | 2.9 | 7.9 |
Early leaving from education: Romania and the EU average
An entirely different concept from the dropout rate above, and seventeen times as large: the share of 18–24-year-olds who completed at most lower secondary education and are in no form of training. The school dropout rate is an administrative figure, from one school year; this one comes from a household survey. The two do not go on the same chart. The years here are CALENDAR years, not school years like the rest of the page: the figure comes from a household survey, not from school records. MIND THIS: the EU average here is published by INS too, not taken from Eurostat — Eurostat's current figures differ by up to 0.2 percentage points, and for Romania in 2008 and 2009 by over 1.5 points. The two lines come from the same matrix, so they are from the same edition of the data.
Romania
15.5 %
2025
EU average
9.1 %
2025
| Period | Romania | EU average |
|---|---|---|
| 2025 | 15.5 | 9.1 |
| 2024 | 16.8 | 9.4 |
| 2023 | 16.6 | 9.5 |
| 2022 | 15.6 | 9.7 |
| 2021 | 15.3 | 9.8 |
| 2020 | 15.6 | 9.9 |
| 2019 | 15.3 | 10.2 |
| 2018 | 16.4 | 10.5 |
| 2017 | 18.1 | 10.5 |
| 2016 | 18.5 | 10.6 |
| 2015 | 19.1 | 11.0 |
| 2014 | 18.1 | 11.1 |
What it means
The school population is the whole of the children in creches and kindergartens, the pupils and the students taking part in the instruction process of a school or academic year, within formal education, whatever the form of schooling, the study programme and the age.
Every year on this page is a SCHOOL year, not a calendar year. INS labels the column “Year 2025” and means the 2025/2026 school year — it says so in its own notes and it shows in the data: the creches, which INS writes entered the indicator “from the 2014/2015 school year”, first appear at exactly 2014.
The definition changed in that very year, and INS does not mark it as a break. Up to 2013 the total covered pre-school children, pre-university education and bachelor's students; from 2014 it additionally covers creches, master's and doctoral studies. The 2.3% rise between 2013 and 2014 is entirely a change of definition: on the old definition, 2014 would have been 1.8% lower than 2013. That is why there are two lines, not one.
The school dropout rate is computed as the difference between the pupils enrolled at the start of the school year and those on the books at the end of it. When a value is missing, the reason is not that INS has not published it yet: INS writes that missing values occur when the number of pupils ROSE between the start and the end of the school year, that is when the rate would be negative.
The dropout rate and the early-leaving rate measure different things and differ from one another by something like seventeen times. The first is administrative, for one school year and one particular level of education. The second comes from a household survey and concerns 18–24-year-olds who completed at most lower secondary education and are no longer studying anything. A sentence of the kind “school dropout in Romania is 15.5%” would be simply false.
History
| Period | School population (the 2014/2015 definition) | School population (the definition up to 2013/2014) |
|---|---|---|
| 2025/2026 | 3,518,702 | – |
| 2024/2025 | 3,485,636 | – |
| 2023/2024 | 3,466,548 | – |
| 2022/2023 | 3,472,784 | – |
| 2021/2022 | 3,495,791 | – |
| 2020/2021 | 3,494,604 | – |
| 2019/2020 | 3,526,189 | – |
| 2018/2019 | 3,547,301 | – |
| 2017/2018 | 3,578,561 | – |
| 2016/2017 | 3,597,280 | – |
| 2015/2016 | 3,642,632 | – |
| 2014/2015 | 3,735,552 | – |
| 2013/2014 | – | 3,650,933 |
| 2012/2013 | – | 3,734,326 |
| 2011/2012 | – | 3,823,515 |
| 2010/2011 | – | 4,029,226 |
| 2009/2010 | – | 4,176,866 |
| 2008/2009 | – | 4,324,992 |
| 2007/2008 | – | 4,404,581 |
| 2006/2007 | – | 4,345,581 |
| 2005/2006 | – | 4,360,831 |
| 2004/2005 | – | 4,403,880 |
| 2003/2004 | – | 4,472,493 |
| 2002/2003 | – | 4,496,786 |
Source: National Institute of Statistics (INS), matrices SCL103A, SCL103L, SCL113A, TGX0653. Period covered: 1990/1991 – 2025/2026. See the source.
Every year on this page is a SCHOOL or academic year: “2025/2026”, not the calendar year 2025. The two lines of the chart are NOT one series: from the 2014/2015 school year INS also counts creche children, master's and doctoral students in the school population, which makes the jump from 2013 to 2014 a change of definition, not a rise. INS declares no break; the separation is ours, and it is checked arithmetically on the row itself.