Date oficiale · National Institute of Statistics (INS)
Retail trade
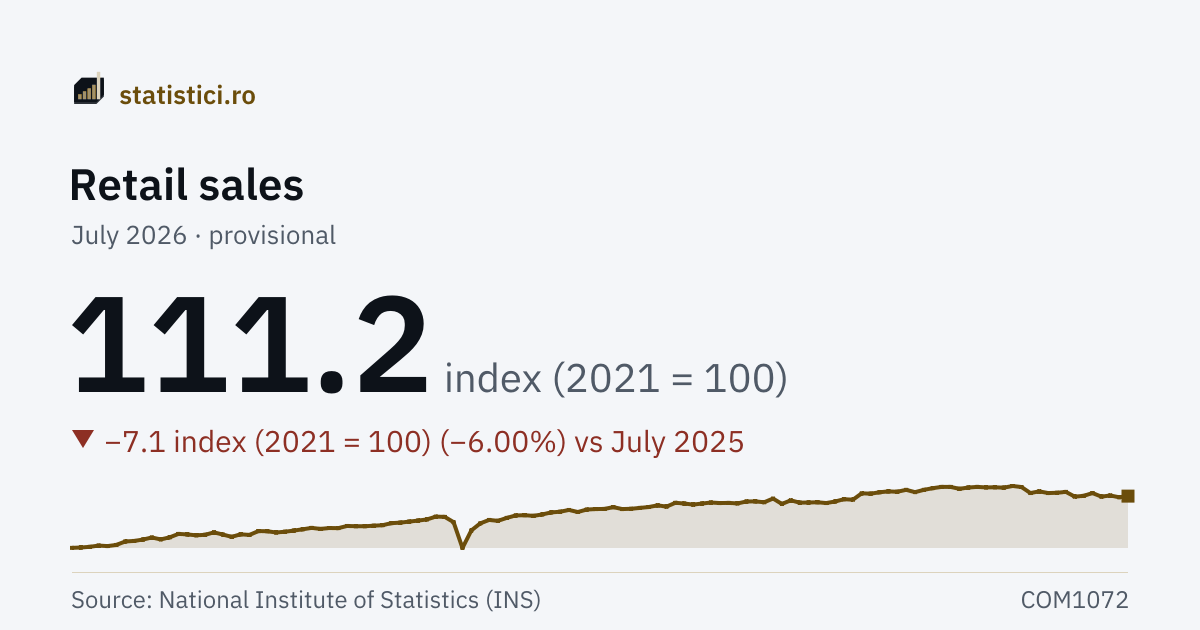
How much Romanians buy in shops each month, in volume — that is, once prices are taken out — against the 2021 average.
Retail sales
111.2 index (2021 = 100)
July 2026 · provisional
The “Retail sales” series
- Series high
- 119.1 index (2021 = 100)June 2025
- Series low
- 32.1 index (2021 = 100)May 2005
- Months published
- 259since January 2005
Trends
Take this chart
You may use the PNG image or the embedded chart (iframe) on your own site. The iframe updates itself when new data arrive. The attribution and the link to the source are included automatically.
What it means
It is the closest monthly indicator to household consumption: the turnover of the shops, with prices taken out so that volume is left. A rise means more was bought, not that more was spent. The index does not cover the sale and repair of motor vehicles, which is published separately.
Like industrial production, the series is adjusted for the number of working days and for seasonality, so December no longer leaves the chart simply for being December. The base is the monthly average of 2021.
History
| Period | Retail sales |
|---|---|
| July 2026 | 111.2 prov. |
| June 2026 | 110.3 |
| May 2026 | 111.7 |
| April 2026 | 110.8 |
| March 2026 | 113.6 |
| February 2026 | 111.4 |
| January 2026 | 110.8 |
| December 2025 | 114.5 prov. |
| November 2025 | 113.8 |
| October 2025 | 113.6 |
| September 2025 | 114.9 |
| August 2025 | 113.6 |
| July 2025 | 118.3 |
| June 2025 | 119.1 |
| May 2025 | 117.8 |
| April 2025 | 118.1 |
| March 2025 | 118.0 |
| February 2025 | 118.4 |
| January 2025 | 117.9 |
| December 2024 | 116.9 prov. |
| November 2024 | 118.4 |
| October 2024 | 118.4 |
| September 2024 | 117.4 |
| August 2024 | 116.1 |
Year by year
Every year has its own page, with all its periods, the average, the minimum and the maximum.
2026 2025 2024 2023 2022 2021 2020 2019 2018 2017 2016 2015 2014 2013 2012 2011 2010 2009 2008 2007 2006 2005
Source: National Institute of Statistics (INS), matrix COM1072. Period covered: January 2005 – July 2026. See the source. Figures marked “provisional” or “semi-final” may be revised by INS.
The VOLUME index of retail trade turnover, excluding the sale and repair of motor vehicles, a series adjusted for the number of working days and for seasonality, base 2021 = 100.