Date oficiale · National Institute of Statistics (INS)
Dwellings completed
How many new dwellings are completed in a year in Romania — the natural companion of the building permits, at the other end of the site.
Dwellings completed
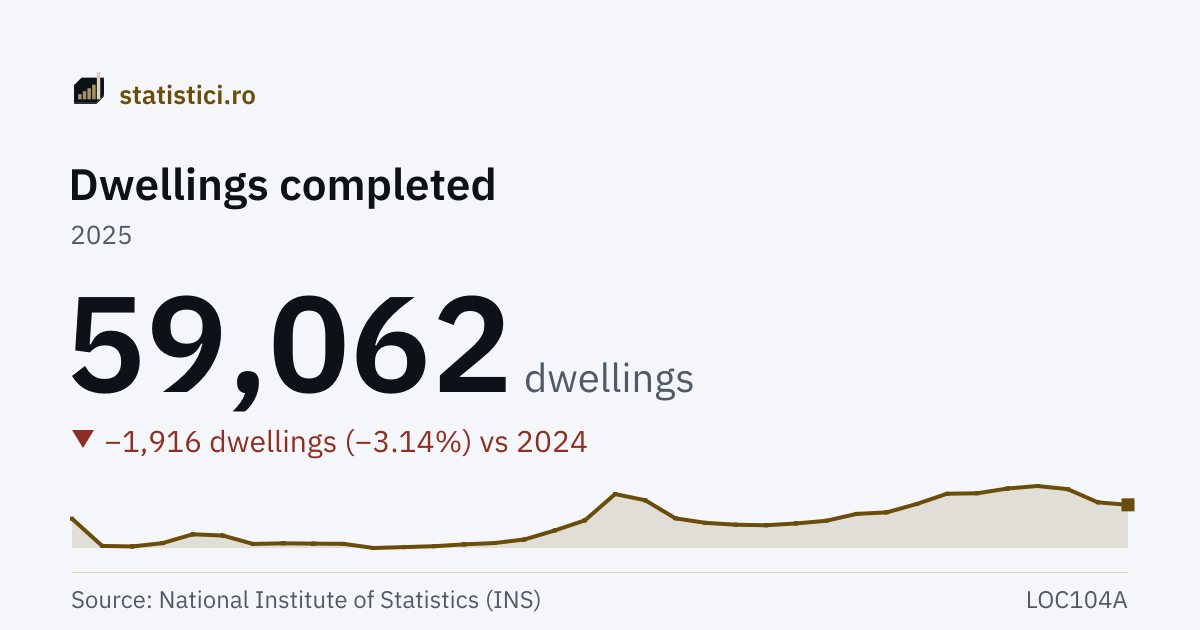
59,062 dwellings
2025
The “Dwellings completed” series
- Series high
- 73,338 dwellings2022
- Series low
- 26,376 dwellings2000
- Years published
- 36since 1990
Trends
Take this chart
You may use the PNG image or the embedded chart (iframe) on your own site. The iframe updates itself when new data arrive. The attribution and the link to the source are included automatically.
By source of funding
The same dwellings, split by where the money came from. The two add up to the figure above in every year.
From private funds
56,416 dwellings
2025
From public funds
2,646 dwellings
2025
| Period | From private funds | From public funds |
|---|---|---|
| 2025 | 56,416 | 2,646 |
| 2024 | 58,279 | 2,699 |
| 2023 | 68,989 | 1,968 |
| 2022 | 71,943 | 1,395 |
| 2021 | 69,770 | 1,635 |
| 2020 | 66,035 | 1,781 |
| 2019 | 66,626 | 862 |
| 2018 | 57,709 | 2,004 |
| 2017 | 51,578 | 1,769 |
| 2016 | 50,978 | 1,228 |
| 2015 | 45,687 | 1,297 |
| 2014 | 41,660 | 3,324 |
What it means
A dwelling completed during a year is, in INS's definition, a construction with that purpose finished entirely in the reference year, which did not exist before — whose elements, the foundation included, were built for the first time — and on which every category of work provided for in the execution documents was carried out, having been accepted by the beneficiaries.
The figure also covers the dwellings people built for themselves, reported by the county and local councils, not only those put up by companies. The panel below shows where the money came from: in 1990 the state completed 42,820 dwellings and private funds 5,779; in 2025, 2,646 against 56,416. It is not only the number that changed, but who builds.
History
| Period | Dwellings completed |
|---|---|
| 2025 | 59,062 |
| 2024 | 60,978 |
| 2023 | 70,957 |
| 2022 | 73,338 |
| 2021 | 71,405 |
| 2020 | 67,816 |
| 2019 | 67,488 |
| 2018 | 59,713 |
| 2017 | 53,347 |
| 2016 | 52,206 |
| 2015 | 46,984 |
| 2014 | 44,984 |
| 2013 | 43,587 |
| 2012 | 44,016 |
| 2011 | 45,419 |
| 2010 | 48,862 |
| 2009 | 62,520 |
| 2008 | 67,255 |
| 2007 | 47,299 |
| 2006 | 39,638 |
| 2005 | 32,868 |
| 2004 | 30,127 |
| 2003 | 29,125 |
| 2002 | 27,722 |
Source: National Institute of Statistics (INS), matrix LOC104A. Period covered: 1990 – 2025. See the source.
The data are annual. The building permits, on their own page, are monthly: a permit is issued at the start of the work and the dwelling is finished later, so the two figures are not compared month by month, nor year by year.