Date oficiale · National Institute of Statistics (INS)
Average wage in Romania
The monthly figures published by National Institute of Statistics (INS), from January 2000 to July 2026.
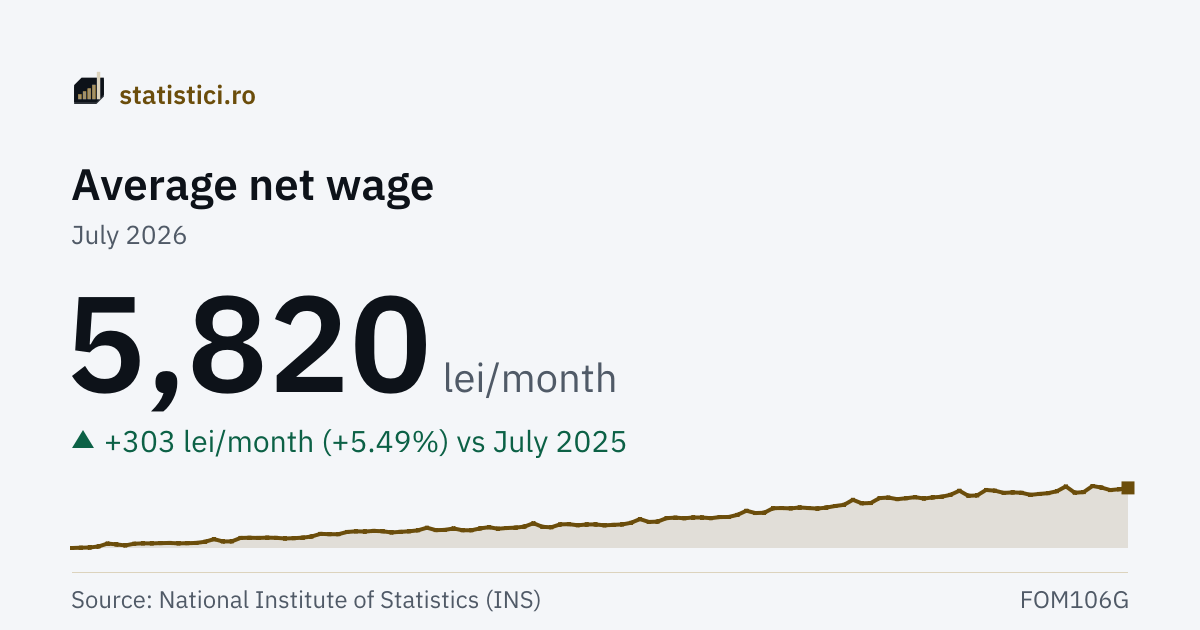
Average net wage
5,820 lei/month
July 2026
Average gross wage
9,709 lei/month
July 2026
The “Average net wage” series
- Series high
- 5,938 lei/monthMarch 2026
- Series low
- 173 lei/monthJanuary 2000
- Months published
- 319since January 2000
Trends
Take this chart
You may use the PNG image or the embedded chart (iframe) on your own site. The iframe updates itself when new data arrive. The attribution and the link to the source are included automatically.
What it means
It is the average monthly earning of one employee, computed by the National Institute of Statistics from a monthly statistical survey. In January 2026 the sample covered about 23,200 economic and social units; budget-funded units are covered in full, and from the economic sector those with four employees or more, which account for 88.07% of that sector's employees.
Net pay is obtained by subtracting from gross pay the employee's compulsory social contributions — the social security contribution and the health insurance contribution — and the corresponding income tax. The difference between the two figures above is exactly what is withheld at source.
It is an arithmetic mean, not a typical wage: high salaries pull it up, so more than half of all employees earn less than this figure. For "what the person in the middle earns" you would need the median wage, which INS does not publish monthly.
The figure excludes severance payments and sums paid retroactively under court rulings for earlier years. It is a monthly gross or net earning, not the employer's total cost of labour.
By activity, the figures are aggregated by the unit's HOMOGENEOUS activity, not by each employee's occupation: secondary activities carried out inside an institution each count under their own activity, not under the institution's. "Health" and "education" include the private sector, and the armed forces and personnel assimilated to them are not covered anywhere in these figures.
Average wage by activity
Average net and gross earnings in each activity, from January 2025 — the first month of the CANE Rev.3 classification. The activity series do NOT connect to the earlier history: when the classification changed, section letters were reassigned, and "P" means education in the old one and public administration in the new, 1,231 lei apart. The wages in the table do not add up and cannot be averaged together: the national figure is weighted by the number of employees in each activity.
The page has figures for 11 activities of 11.
| # | activity | lei/month |
|---|---|---|
| 1 | IT (programming and consultancy) | 13,464 |
| 2 | Telecoms and IT (section K) | 11,643 |
| 3 | Financial services and insurance | 9,554 |
| 4 | Public administration and defence | 6,997 |
| 5 | Transport and storage | 5,723 |
| 6 | Education | 5,646 |
| 7 | Manufacturing | 5,506 |
| 8 | Health and social work | 5,485 |
| 9 | Construction | 5,338 |
| 10 | Wholesale and retail trade | 5,331 |
| 11 | Hotels and restaurants | 3,634 |
History
| Period | Average net wage | Average gross wage |
|---|---|---|
| July 2026 | 5,820 | 9,709 |
| June 2026 | 5,734 | 9,564 |
| May 2026 | 5,684 | 9,483 |
| April 2026 | 5,843 | 9,740 |
| March 2026 | 5,938 | 9,902 |
| February 2026 | 5,557 | 9,272 |
| January 2026 | 5,518 | 9,220 |
| December 2025 | 5,914 | 9,868 |
| November 2025 | 5,615 | 9,371 |
| October 2025 | 5,492 | 9,152 |
| September 2025 | 5,443 | 9,078 |
| August 2025 | 5,387 | 9,002 |
| July 2025 | 5,517 | 9,201 |
| June 2025 | 5,539 | 9,246 |
| May 2025 | 5,508 | 9,187 |
| April 2025 | 5,647 | 9,415 |
| March 2025 | 5,691 | 9,495 |
| February 2025 | 5,351 | 8,932 |
| January 2025 | 5,328 | 8,910 |
| December 2024 | 5,645 | 9,251 |
| November 2024 | 5,388 | 8,825 |
| October 2024 | 5,268 | 8,612 |
| September 2024 | 5,228 | 8,553 |
| August 2024 | 5,158 | 8,443 |
Year by year
Every year has its own page, with all its periods, the average, the minimum and the maximum.
2026 2025 2024 2023 2022 2021 2020 2019 2018 2017 2016 2015 2014 2013 2012 2011 2010 2009 2008 2007 2006 2005 2004 2003 2002 2001 2000
Source: National Institute of Statistics (INS), matrices FOM106D, FOM106G, FOM107D, FOM107G. Period covered: January 2000 – July 2026. See the source.
The gross series is not comparable across January 2018, and INS says so itself: under Emergency Ordinance 79/2017 the social security and health contributions that used to be paid by the employer passed to the employee, and have been reflected in GROSS earnings ever since. It shows in the figures — total economy, December 2017: 3,662 lei gross, January 2018: 4,143 lei, without anybody being paid more. NET pay is unaffected: INS writes explicitly that the transfer "does not influence the comparability of the data" for the net series.