Date oficiale · National Institute of Statistics (INS)
Prices by group of goods and services
How much dearer or cheaper food, non-food goods, services and energy have become, against the same month of the previous year.
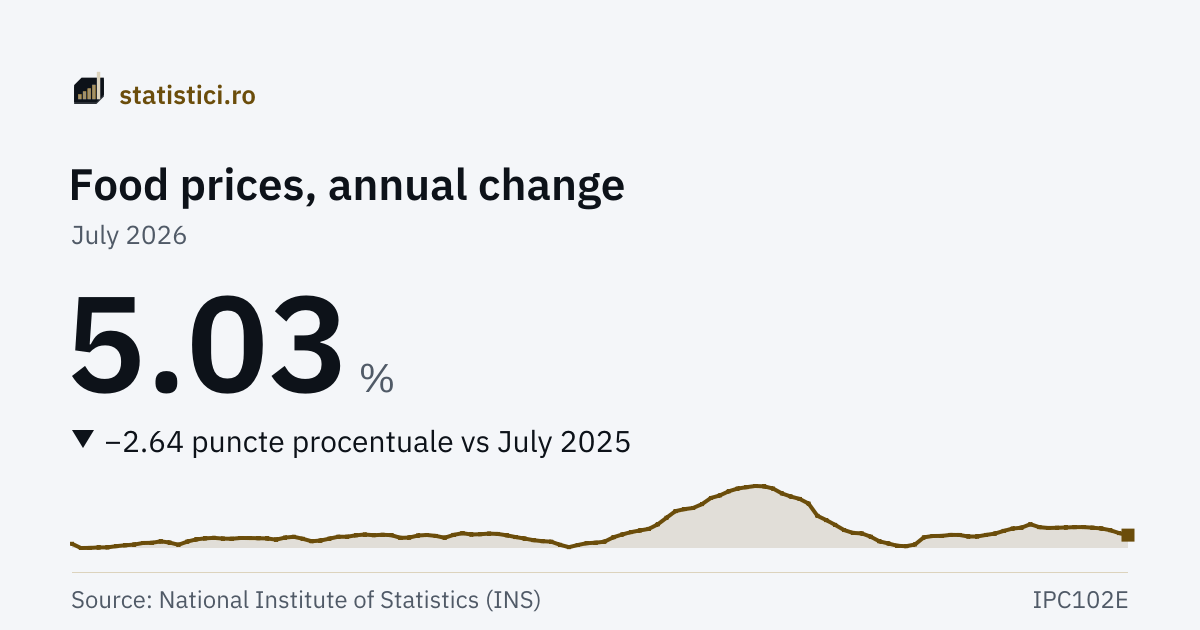
Food
5.03 %
July 2026
Non-food goods
7.93 %
July 2026
Services
13.67 %
July 2026
The “Food” series
- Series high
- 43.20 %April 2001
- Series low
- −7.57 %May 2016
- Months published
- 307since January 2001
Trends
Take this chart
You may use the PNG image or the embedded chart (iframe) on your own site. The iframe updates itself when new data arrive. The attribution and the link to the source are included automatically.
Energy and fuels
The same annual changes, for the groups every household feels. Mind the base effect: a group can show a small rise after a year in which it rose a great deal, because it is being compared with an already high level — not because the price fell.
Fuels
16.87 %
July 2026
Electricity
3.39 %
July 2026
Natural gas
0.97 %
July 2026
District heating
10.70 %
July 2026
Derived figure. The same derivation as above: the index minus 100.
| Period | Fuels | Electricity | Natural gas | District heating |
|---|---|---|---|---|
| July 2026 | 16.87 | 3.39 | 0.97 | 10.70 |
| June 2026 | 16.02 | 59.97 | 4.70 | 10.70 |
| May 2026 | 19.24 | 55.49 | 1.53 | 10.70 |
| April 2026 | 15.65 | 54.18 | 6.38 | 10.70 |
| March 2026 | 12.93 | 57.20 | −7.08 | 13.41 |
| February 2026 | 4.19 | 56.92 | −4.57 | 13.41 |
| January 2026 | 3.46 | 59.33 | 4.23 | 15.61 |
| December 2025 | 3.94 | 60.91 | 7.72 | 18.80 |
| November 2025 | 6.07 | 62.36 | 5.01 | 18.80 |
| October 2025 | 5.03 | 72.30 | 3.11 | 17.70 |
| September 2025 | 7.37 | 69.16 | −2.04 | 13.63 |
| August 2025 | 4.40 | 65.73 | −0.64 | 13.63 |
What it means
The figures on this page are NOT prices in lei and are not indices: they are percentage changes in the prices of a group, against the same month of the previous year. INS publishes indices with base 100 — an index of 105.03 means the group's prices are 5.03% higher than a year ago — and the site shows exactly that rate. A negative value is a real fall in prices, not an error.
The consumer price index measures the overall movement in the prices of the goods bought and the tariffs of the services used by the population, against an earlier period. It is computed only for what enters the population's direct consumption: consumption from own resources, investment spending, interest on loans, insurance premiums, fines and taxes are excluded.
It is a fixed-base Laspeyres index: the prices of each variety are aggregated in turn — at the level of an expenditure item, then of a group, then of the general index — through weights that are updated annually. For that reason the groups do NOT add up to the total: in July 2026, food, non-food goods and services would together give 326.63 if the indices were added, against a total of 108.16. No group here is a “part” of general inflation that can be summed.
The base effect changes how a twelve-month chart reads. Electricity reached +62.97% in July 2025, after the price cap ended, and shows +3.39% in July 2026 — the price did not fall, the jump merely left the comparison base. A group compared with an already expensive month looks calm.
The inflation a particular household feels may differ from any of these figures: the index is an average over the whole population, and a family that spends more on energy or on food than the average feels the same price rises differently.
History
| Period | Food | Non-food goods | Services |
|---|---|---|---|
| July 2026 | 5.03 | 7.93 | 13.67 |
| June 2026 | 5.75 | 12.29 | 13.67 |
| May 2026 | 6.78 | 12.54 | 13.53 |
| April 2026 | 7.39 | 12.02 | 13.04 |
| March 2026 | 7.67 | 10.89 | 11.05 |
| February 2026 | 7.89 | 9.41 | 11.37 |
| January 2026 | 7.86 | 9.99 | 11.59 |
| December 2025 | 7.75 | 10.48 | 11.00 |
| November 2025 | 7.64 | 10.73 | 10.99 |
| October 2025 | 7.57 | 10.96 | 10.52 |
| September 2025 | 7.86 | 11.09 | 10.36 |
| August 2025 | 8.92 | 10.48 | 9.85 |
| July 2025 | 7.67 | 8.18 | 7.33 |
| June 2025 | 7.36 | 3.90 | 7.05 |
| May 2025 | 6.53 | 4.00 | 7.09 |
| April 2025 | 5.57 | 3.53 | 6.83 |
| March 2025 | 5.10 | 3.84 | 6.99 |
| February 2025 | 4.54 | 4.79 | 6.42 |
| January 2025 | 4.54 | 4.60 | 6.54 |
| December 2024 | 5.09 | 4.38 | 7.10 |
| November 2024 | 5.11 | 4.15 | 7.56 |
| October 2024 | 4.75 | 3.45 | 7.66 |
| September 2024 | 4.72 | 3.30 | 7.88 |
| August 2024 | 4.25 | 4.35 | 8.60 |
Year by year
Every year has its own page, with all its periods, the average, the minimum and the maximum.
2026 2025 2024 2023 2022 2021 2020 2019 2018 2017 2016 2015 2014 2013 2012 2011 2010 2009 2008 2007 2006 2005 2004 2003 2002 2001
Source: National Institute of Statistics (INS), matrix IPC102E. Period covered: January 2001 – July 2026. See the source.
Every figure on this page is a price CHANGE in percent, against the same month of the previous year — not a price in lei and not an index. A negative value means that group became cheaper.
Derived figure. INS publishes consumer price indices, with the comparison period equal to 100. The figures here are the rates they stand for, computed as the index minus 100 (an index of 105.03 means a rise of 5.03%, and 92.92 a fall of 7.08%).