Date oficiale · National Institute of Statistics (INS)
Inflation in Romania
The monthly figures published by National Institute of Statistics (INS), from January 1991 to July 2026.
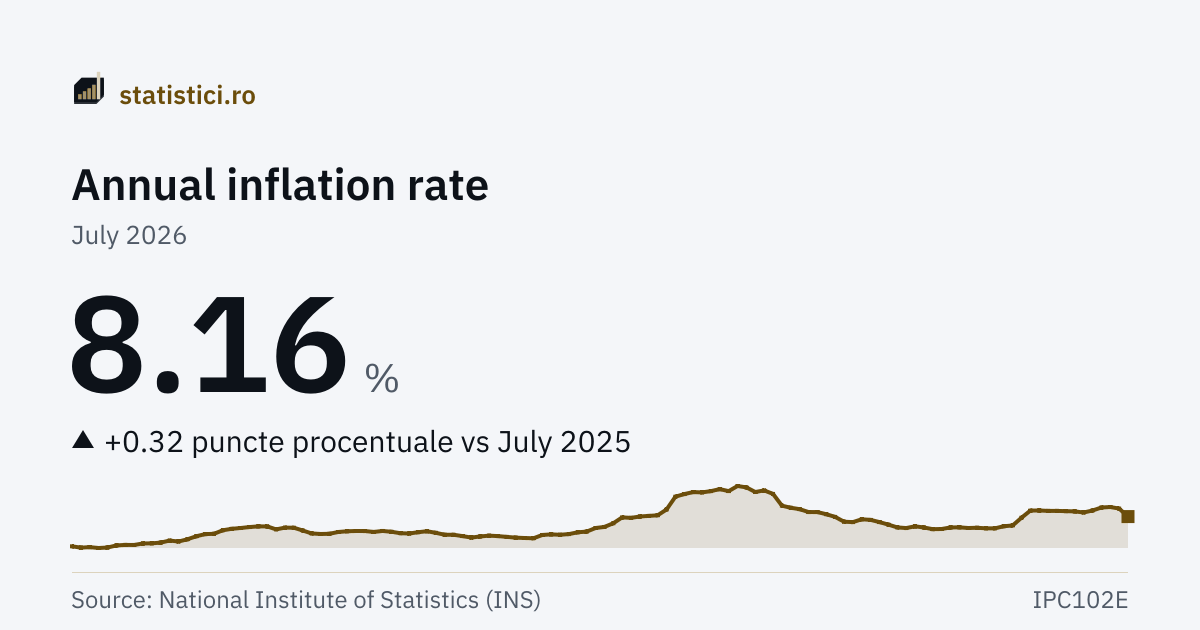
Annual inflation rate
8.16 %
July 2026
Monthly change in prices
0.58 %
July 2026
The “Annual inflation rate” series
- Series high
- 40.30 %March 2001
- Series low
- −3.46 %May 2016
- Months published
- 307since January 2001
Trends
Take this chart
You may use the PNG image or the embedded chart (iframe) on your own site. The iframe updates itself when new data arrive. The attribution and the link to the source are included automatically.
Inflation since the start of the year
How much prices have risen from 31 December of the previous year to the month shown. It is the figure the question “how much has inflation been this year” refers to in mid-year; in December it coincides with the annual rate above.
Inflation cumulated since the start of the year
4.37 %
July 2026
Derived figure. INS publishes an index with December of the previous year = 100 as its base. The figures here are the rates they stand for, computed as the index minus 100. Checked: in every year from 2001 to 2025, the December value is exactly the annual rate published for that month.
| Period | Inflation cumulated since the start of the year |
|---|---|
| July 2026 | 4.37 |
| June 2026 | 3.77 |
| May 2026 | 3.71 |
| April 2026 | 3.11 |
| March 2026 | 2.25 |
| February 2026 | 1.46 |
| January 2026 | 0.86 |
| December 2025 | 9.69 |
| November 2025 | 9.45 |
| October 2025 | 8.99 |
| September 2025 | 8.45 |
| August 2025 | 8.06 |
Romania against the European Union
The comparison does not use the national index but the harmonised index of consumer prices (HICP) — the only one computed the same way in every member state, and therefore the only one that can be compared across countries. Its figures differ from those above.
Romania
8.60 %
December 2025
European Union
2.30 %
December 2025
The source of this comparison: Eurostat, December 2025. See the source.
What it means
The consumer price index measures the overall movement in the prices of the goods bought and the tariffs of the services used by the population, against an earlier period. The annual rate compares the current month with the same month of last year; the monthly change compares it with the month before.
It is computed as a fixed-base Laspeyres index: a basket of goods and services with constant weights, taken from the consumption structure of two years ago and updated annually. The fixed weights are what makes prices comparable over time, without a change in consumption habits mixing itself into the result.
The basket covers only what enters the population's direct consumption. Consumption from own resources, investment spending, interest on loans, insurance premiums, fines and taxes are excluded.
The inflation a particular household feels may differ from the published figure: the index is an average over the whole population, and a family that spends more on energy or on food than the average feels the same price rises differently.
History
| Period | Annual inflation rate | Monthly change in prices |
|---|---|---|
| July 2026 | 8.16 | 0.58 |
| June 2026 | 10.42 | 0.06 |
| May 2026 | 10.85 | 0.58 |
| April 2026 | 10.71 | 0.84 |
| March 2026 | 9.87 | 0.78 |
| February 2026 | 9.31 | 0.59 |
| January 2026 | 9.62 | 0.86 |
| December 2025 | 9.69 | 0.22 |
| November 2025 | 9.76 | 0.42 |
| October 2025 | 9.76 | 0.50 |
| September 2025 | 9.88 | 0.36 |
| August 2025 | 9.85 | 2.10 |
| July 2025 | 7.84 | 2.68 |
| June 2025 | 5.66 | 0.45 |
| May 2025 | 5.45 | 0.46 |
| April 2025 | 4.85 | 0.07 |
| March 2025 | 4.86 | 0.27 |
| February 2025 | 5.02 | 0.88 |
| January 2025 | 4.95 | 0.92 |
| December 2024 | 5.14 | 0.29 |
| November 2024 | 5.11 | 0.41 |
| October 2024 | 4.67 | 0.62 |
| September 2024 | 4.62 | 0.33 |
| August 2024 | 5.10 | 0.23 |
Year by year
Every year has its own page, with all its periods, the average, the minimum and the maximum.
2026 2025 2024 2023 2022 2021 2020 2019 2018 2017 2016 2015 2014 2013 2012 2011 2010 2009 2008 2007 2006 2005 2004 2003 2002 2001 2000 1999 1998 1997 1996 1995 1994 1993 1992 1991
Source: National Institute of Statistics (INS), matrices IPC102A, IPC102B, IPC102E. Period covered: January 1991 – July 2026. See the source.
The annual rate compares the current month with the same month of the previous year; the monthly change compares it with the month before.
Derived figure. INS publishes consumer price indices, with the comparison period equal to 100. The figures here are the rates they stand for, computed as the index minus 100 (an index of 108.16, for instance, means a rate of 8.16%).