Date oficiale · National Institute of Statistics (INS)
Gross domestic product (GDP)
How much Romania's economy produces in a quarter, how fast it grows in real terms and how much falls, per year, to one inhabitant. These are three different figures, in three different units.
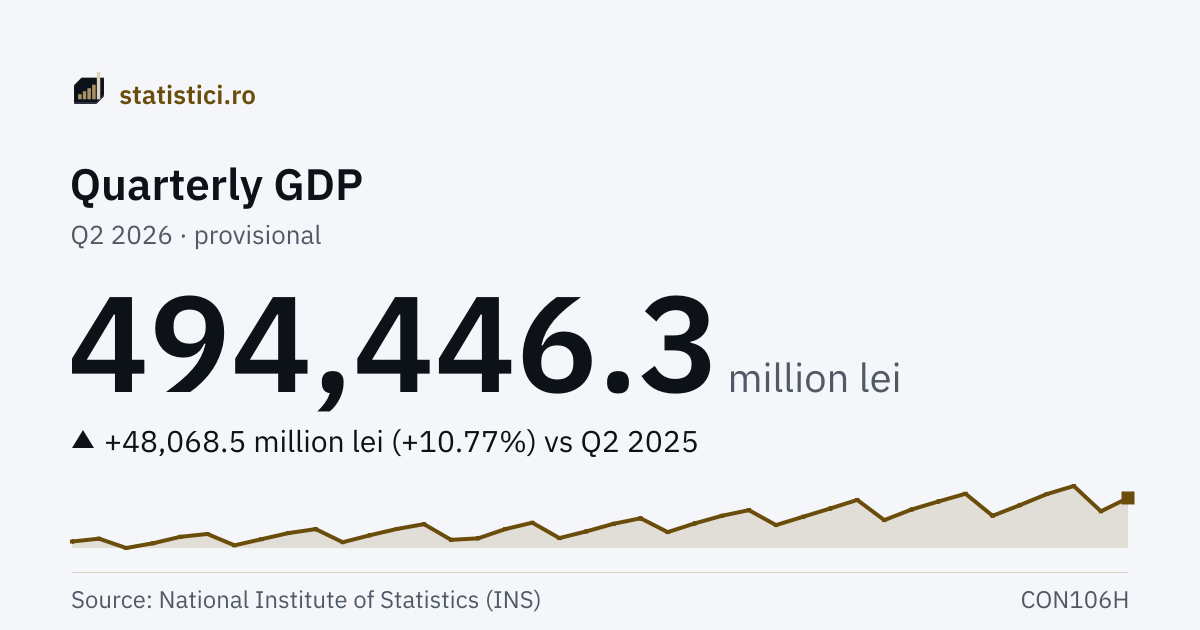
Quarterly GDP, current prices
494,446.3 million lei
Q2 2026 · provisional
The “Quarterly GDP, current prices” series
- Series high
- 573,630.9 million leiQ4 2025 · provisional
- Series low
- 1,461.3 million leiQ1 1995
- Quarters published
- 126since Q1 1995
Trends
Take this chart
You may use the PNG image or the embedded chart (iframe) on your own site. The iframe updates itself when new data arrive. The attribution and the link to the source are included automatically.
Real economic growth
How much the economy grew in real terms against the same quarter of the previous year, that is once the effect of prices is removed. It is the seasonally adjusted series, the one INS computes its growth rates from and the one Eurostat publishes. It cannot be obtained by dividing two values from the chart above: those are in current prices and include inflation.
Real GDP growth
−2.0 %
Q2 2026 · provisional
Derived figure. INS publishes a volume index with base 100, even though the unit in the matrix reads “Percent”. The figures here are the rates it stands for, computed as the index minus 100 (an index of 98.0 means a fall of 2.0%).
| Period | Real GDP growth |
|---|---|
| Q2 2026 | −2.0 prov. |
| Q1 2026 | −1.1 prov. |
| Q4 2025 | −1.4 prov. |
| Q3 2025 | 1.4 prov. |
| Q2 2025 | 2.1 prov. |
| Q1 2025 | 0.7 prov. |
| Q4 2024 | 0.8 semi-fin. |
| Q3 2024 | 0.3 semi-fin. |
| Q2 2024 | 0.5 semi-fin. |
| Q1 2024 | 2.1 semi-fin. |
| Q4 2023 | 2.2 |
| Q3 2023 | 2.9 |
GDP per capita
Gross domestic product divided by the number of inhabitants, in current prices. It is an ANNUAL figure — INS does not publish quarterly GDP per capita — and it is published on a different rhythm from the quarterly figures above, so it is normally a year behind. It is not any person's average income: it is the economy's output divided by the population.
GDP per capita
100,634.9 lei per inhabitant
2025 · provisional
| Period | GDP per capita |
|---|---|
| 2025 | 100,634.9 prov. |
| 2024 | 92,299.4 semi-fin. |
| 2023 | 83,437.3 |
| 2022 | 72,669.5 |
| 2021 | 61,963.9 |
| 2020 | 55,122.6 |
| 2019 | 54,646.3 |
| 2018 | 48,914.9 |
| 2017 | 43,465.7 |
| 2016 | 38,166.7 |
| 2015 | 35,946.9 |
| 2014 | 33,585.6 |
What it means
Gross domestic product is the final result of the production activity of resident producer units over a period — here, a quarter. INS estimates it by two methods which must give the same result: the production approach (gross value added, plus taxes on products, minus subsidies on products) and the expenditure approach (actual final consumption, plus gross capital formation, plus exports, minus imports).
The figure at the top is in current prices: it includes the rise in prices too. The real growth, in the next panel, takes that out — which is why the two can move in opposite directions. In the second quarter of 2026, nominal GDP was 10.8% higher than a year earlier, while the economy had shrunk by 2.0% in real terms.
The data are estimated from infra-annual surveys on industrial, construction, services and trade output, from the agricultural production account, from the balance sheets of financial institutions and from administrative sources — the execution of the state budget, of the local budgets and of the social insurance budget, plus the balance of payments. They are estimates, not a count.
The series is revised along its whole length, not only at its tail: INS recomputes the quarterly accounts whenever a new version of the annual accounts appears, and revising the unadjusted series drags the seasonally adjusted ones with it. Figures marked “provisional” or “semi-final” will change.
The four quarters add up to annual GDP, but only for the level. The average of the four quarterly growth rates is NOT the year's economic growth: they are two different quantities, and in a volatile year they differ visibly.
History
| Period | Quarterly GDP, current prices |
|---|---|
| Q2 2026 | 494,446.3 prov. |
| Q1 2026 | 405,907.7 prov. |
| Q4 2025 | 573,630.9 prov. |
| Q3 2025 | 520,065.7 prov. |
| Q2 2025 | 446,377.8 prov. |
| Q1 2025 | 376,330.5 prov. |
| Q4 2024 | 522,309.8 semi-fin. |
| Q3 2024 | 471,315.4 semi-fin. |
| Q2 2024 | 417,702.2 semi-fin. |
| Q1 2024 | 347,855.9 semi-fin. |
| Q4 2023 | 481,557.4 |
| Q3 2023 | 424,488.3 |
| Q2 2023 | 369,869.5 |
| Q1 2023 | 314,834.2 |
| Q4 2022 | 413,935.3 |
| Q3 2022 | 376,285.0 |
| Q2 2022 | 326,029.1 |
| Q1 2022 | 268,348.4 |
| Q4 2021 | 360,135.7 |
| Q3 2021 | 323,413.5 |
| Q2 2021 | 273,533.2 |
| Q1 2021 | 228,933.0 |
| Q4 2020 | 330,742.6 |
| Q3 2020 | 288,353.0 |
Year by year
Every year has its own page, with all its periods, the average, the minimum and the maximum.
2026 2025 2024 2023 2022 2021 2020 2019 2018 2017 2016 2015 2014 2013 2012 2011 2010 2009 2008 2007 2006 2005 2004 2003 2002 2001 2000 1999 1998 1997 1996 1995
Source: National Institute of Statistics (INS), matrices CON104V, CON106H, CON107B. Period covered: 1995 – Q2 2026. See the source. Figures marked “provisional” or “semi-final” may be revised by INS.
The level is in current prices, an unadjusted series (not seasonally adjusted). The real growth, in the panel on the GDP page, comes from the seasonally adjusted series and is something else: the nominal level can rise while the economy shrinks in real terms. INS revises the quarterly accounts periodically, whenever a new version of the annual accounts appears.