Date oficiale · National Institute of Statistics (INS)
Life expectancy
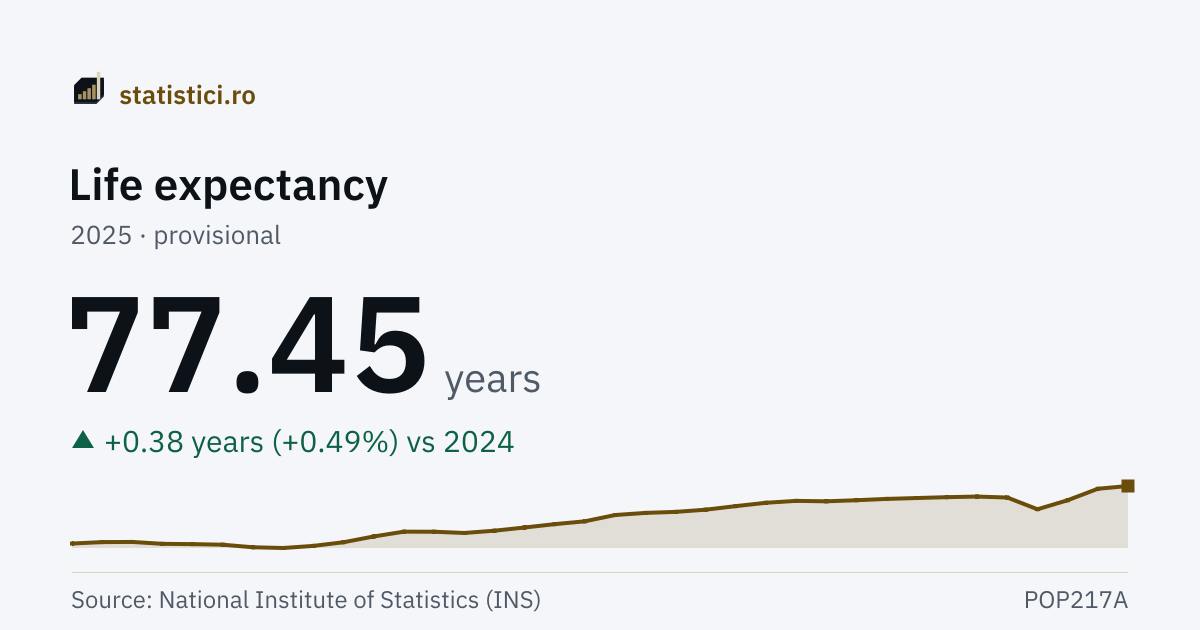
How many years a newborn has to live, on average, if they were to live the whole of their life under the mortality conditions of the reference year.
Life expectancy
77.45 years
2025 · provisional
The “Life expectancy” series
- Series high
- 77.45 years2025 · provisional
- Series low
- 68.95 years1997
- Years published
- 36since 1990
Trends
Take this chart
You may use the PNG image or the embedded chart (iframe) on your own site. The iframe updates itself when new data arrive. The attribution and the link to the source are included automatically.
By sex
The same measure, computed separately for men and for women. The gap between them has not fallen below seven years in any of the published years.
Men
73.88 years
2025 · provisional
Women
81.02 years
2025 · provisional
| Period | Men | Women |
|---|---|---|
| 2025 | 73.88 prov. | 81.02 prov. |
| 2024 | 73.47 | 80.69 |
| 2023 | 71.95 | 79.15 |
| 2022 | 70.71 | 78.00 |
| 2021 | 72.23 | 79.66 |
| 2020 | 72.42 | 79.67 |
| 2019 | 72.39 | 79.51 |
| 2018 | 72.32 | 79.34 |
| 2017 | 72.21 | 79.20 |
| 2016 | 72.04 | 79.03 |
| 2015 | 71.88 | 78.86 |
| 2014 | 71.97 | 78.89 |
What it means
Life expectancy at birth is not a forecast about those born today: it is a measure OF THE YEAR it is computed in. It says how many years a newborn would live on average IF they met, at every age, exactly the mortality observed in that year. When mortality falls, the figure rises — and in a year of exceptional mortality, as 2020 and 2021 were, it drops sharply without anybody's actual lifespan having changed.
The gap between the sexes is wide and steady: in 2025, 73.88 years for men and 81.02 for women, that is over seven years. The panel below shows the two series separately.
History
| Period | Life expectancy |
|---|---|
| 2025 | 77.45 prov. |
| 2024 | 77.07 |
| 2023 | 75.50 |
| 2022 | 74.26 |
| 2021 | 75.87 |
| 2020 | 76.00 |
| 2019 | 75.92 |
| 2018 | 75.80 |
| 2017 | 75.68 |
| 2016 | 75.50 |
| 2015 | 75.35 |
| 2014 | 75.41 |
| 2013 | 75.15 |
| 2012 | 74.69 |
| 2011 | 74.20 |
| 2010 | 73.90 |
| 2009 | 73.76 |
| 2008 | 73.47 |
| 2007 | 72.61 |
| 2006 | 72.22 |
| 2005 | 71.76 |
| 2004 | 71.32 |
| 2003 | 71.01 |
| 2002 | 71.18 |
Source: National Institute of Statistics (INS), matrix POP217A. Period covered: 1990 – 2025. See the source. Figures marked “provisional” or “semi-final” may be revised by INS.
INS calls it “the average length of life”. It is calculated from that year's age-specific mortality rates and from the population by residence registered on 1 July.