Date oficiale · National Institute of Statistics (INS)
Births and deaths
How many children are born and how many people die in Romania in a year, from 1990 onwards, and the gap between the two — the natural increase, which INS publishes itself.
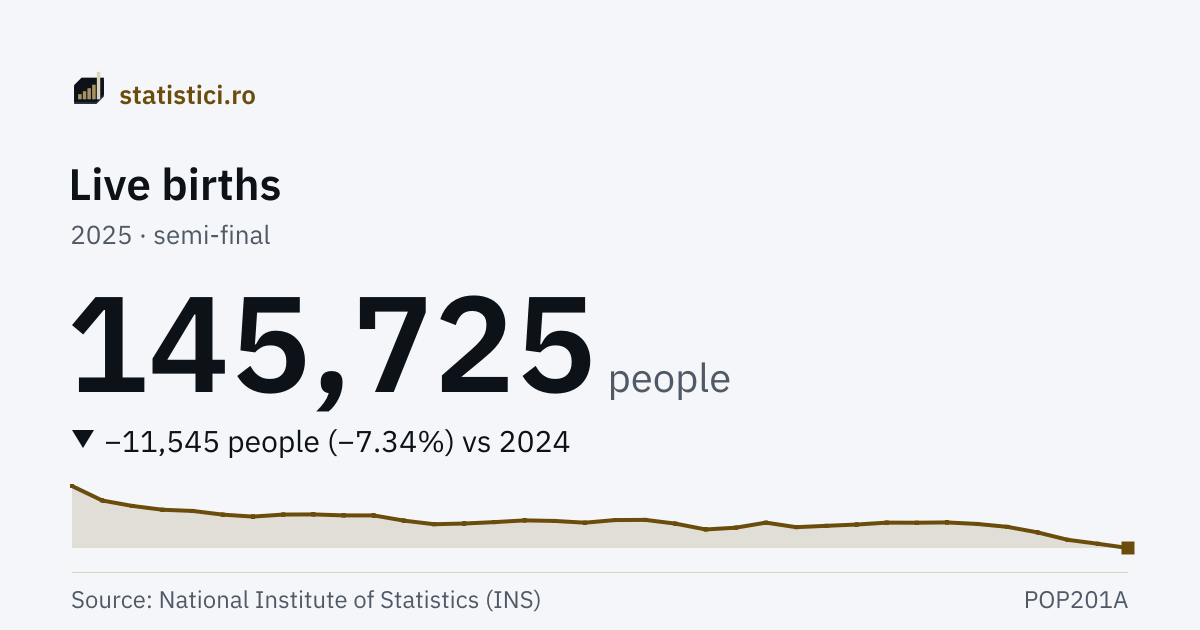
Live births
145,725 people
2025 · semi-final
Deaths
239,691 people
2025 · semi-final
The “Live births” series
- Series high
- 314,746 people1990
- Series low
- 145,725 people2025 · semi-final
- Years published
- 36since 1990
Trends
Take this chart
You may use the PNG image or the embedded chart (iframe) on your own site. The iframe updates itself when new data arrive. The attribution and the link to the source are included automatically.
Natural increase
The difference between the number of live births and the number of deaths in the reference year. It is the figure INS publishes, not a subtraction of ours — and it matches births minus deaths in all 36 published years.
Natural increase
−93,966 people
2025 · semi-final
| Period | Natural increase |
|---|---|
| 2025 | −93,966 semi-fin. |
| 2024 | −88,428 |
| 2023 | −77,036 |
| 2022 | −85,658 |
| 2021 | −133,260 |
| 2020 | −88,841 |
| 2019 | −45,978 |
| 2018 | −50,880 |
| 2017 | −47,883 |
| 2016 | −49,255 |
| 2015 | −56,791 |
| 2014 | −53,103 |
Per 1,000 inhabitants
The birth rate and the death rate: the number of live births and the number of deaths in the year, divided by INS by the population by domicile on 1 July of the same year. These are the figures Romania is compared with other countries by, and counties with one another — an absolute figure follows the size of the population.
Birth rate
6.7 per 1,000 inhabitants
2025 · provisional
Death rate
11.1 per 1,000 inhabitants
2025 · provisional
The denominator is the population by domicile, not the resident one, and INS says why it matters: “no account is taken of the usual residence, of the length and/or the reason for absence from the domicile”. Anybody who has left the country with a declared domicile in Romania stays in the denominator — 21.6 million by domicile against 19.0 million residents — so the rates here are below those that would be obtained by dividing by the population actually living in the country.
The rates for 1990 and 1991 are computed by INS on a different population source from those that follow: from 1992 onwards they were recomputed after the indicator “population by domicile on 1 July” was disseminated, while for the first two years the long historical population series were used. The revision marking of a rate may differ from that of the absolute figure of the same year, because the denominator has its own revision calendar.
| Period | Birth rate | Death rate |
|---|---|---|
| 2025 | 6.7 prov. | 11.1 prov. |
| 2024 | 7.2 | 11.3 |
| 2023 | 7.5 | 11.2 |
| 2022 | 8.6 | 12.5 |
| 2021 | 9.2 | 15.2 |
| 2020 | 9.5 | 13.5 |
| 2019 | 9.7 | 11.8 |
| 2018 | 9.7 | 12.0 |
| 2017 | 9.7 | 11.8 |
| 2016 | 9.4 | 11.6 |
| 2015 | 9.3 | 11.8 |
| 2014 | 9.1 | 11.5 |
What it means
A live birth is, in INS's definition, the product of conception expelled or extracted entirely from the mother's body, whatever the length of the pregnancy, which after separation shows a sign of life: breathing, cardiac activity, pulsation of the umbilical cord or voluntary muscular contraction. A death is a person whose vital functions ceased definitively after any length of time from birth.
The scope changed in 2012, and INS says so in the notes of both matrices: until 2011 it counted the live births whose mothers had their DOMICILE in Romania and the deaths of people domiciled in Romania; from 2012 it includes those with their domicile OR their usual residence in Romania. The series carries no declared break, but the two halves do not count exactly the same people.
Both figures refer to the events registered at the civil registry offices in Romania. A child born abroad to a Romanian woman and registered there does not enter here, and a person with their usual residence in Romania does, whatever their citizenship.
Births and deaths by county
The same annual figures, county by county, from the same matrices as the national total above. The ranking is by the number of live births, which follows above all the size of the county: the figure that makes two counties of different sizes comparable is the rate per 1,000 inhabitants, published by INS and shown on each county's page, beside the natural increase.
The page has figures for 42 counties of 42. Added up, the 42 counties give 145,725 people in 2025, against 145,725 people for the country as a whole. The figures match exactly.
| # | county | people |
|---|---|---|
| 1 | Bucharest Municipality | 13,353 semi-fin. |
| 2 | Iași | 7,615 semi-fin. |
| 3 | Suceava | 6,919 semi-fin. |
| 4 | Cluj | 5,841 semi-fin. |
| 5 | Timiș | 5,509 semi-fin. |
| 6 | Bihor | 4,919 semi-fin. |
| 7 | Constanța | 4,916 semi-fin. |
| 8 | Brașov | 4,739 semi-fin. |
| 9 | Dolj | 4,443 semi-fin. |
| 10 | Ilfov | 4,415 semi-fin. |
| 11 | Mureș | 4,407 semi-fin. |
| 12 | Bacău | 4,398 semi-fin. |
| 13 | Prahova | 4,313 semi-fin. |
| 14 | Argeș | 3,715 semi-fin. |
| 15 | Maramureș | 3,429 semi-fin. |
| 16 | Sibiu | 3,321 semi-fin. |
| 17 | Galați | 3,280 semi-fin. |
| 18 | Dâmbovița | 3,262 semi-fin. |
| 19 | Neamț | 3,168 semi-fin. |
| 20 | Arad | 3,145 semi-fin. |
| 21 | Vaslui | 3,130 semi-fin. |
| 22 | Botoșani | 2,977 semi-fin. |
| 23 | Bistrița-Năsăud | 2,722 semi-fin. |
| 24 | Buzău | 2,660 semi-fin. |
| 25 | Harghita | 2,449 semi-fin. |
| 26 | Satu Mare | 2,419 semi-fin. |
| 27 | Olt | 2,391 semi-fin. |
| 28 | Vrancea | 2,383 semi-fin. |
| 29 | Alba | 2,277 semi-fin. |
| 30 | Călărași | 2,149 semi-fin. |
| 31 | Hunedoara | 2,110 semi-fin. |
| 32 | Sălaj | 2,068 semi-fin. |
| 33 | Gorj | 1,955 semi-fin. |
| 34 | Ialomița | 1,951 semi-fin. |
| 35 | Vâlcea | 1,937 semi-fin. |
| 36 | Giurgiu | 1,933 semi-fin. |
| 37 | Teleorman | 1,771 semi-fin. |
| 38 | Covasna | 1,642 semi-fin. |
| 39 | Brăila | 1,599 semi-fin. |
| 40 | Caraș-Severin | 1,498 semi-fin. |
| 41 | Mehedinți | 1,421 semi-fin. |
| 42 | Tulcea | 1,176 semi-fin. |
History
| Period | Live births | Deaths |
|---|---|---|
| 2025 | 145,725 semi-fin. | 239,691 semi-fin. |
| 2024 | 157,270 | 245,698 |
| 2023 | 168,079 | 245,115 |
| 2022 | 188,322 | 273,980 |
| 2021 | 203,418 | 336,678 |
| 2020 | 211,273 | 300,114 |
| 2019 | 215,467 | 261,445 |
| 2018 | 214,614 | 265,494 |
| 2017 | 214,928 | 262,811 |
| 2016 | 209,641 | 258,896 |
| 2015 | 206,190 | 262,981 |
| 2014 | 202,501 | 255,604 |
| 2013 | 214,932 | 250,466 |
| 2012 | 201,104 | 255,539 |
| 2011 | 196,242 | 251,439 |
| 2010 | 212,199 | 259,723 |
| 2009 | 222,388 | 257,213 |
| 2008 | 221,900 | 253,202 |
| 2007 | 214,728 | 251,965 |
| 2006 | 219,483 | 258,094 |
| 2005 | 221,020 | 262,101 |
| 2004 | 216,261 | 258,890 |
| 2003 | 212,459 | 266,575 |
| 2002 | 210,529 | 269,666 |
Source: National Institute of Statistics (INS), matrices POP201A, POP202A, POP206B, POP207A, POP214A. Period covered: 1990 – 2025. See the source. Figures marked “provisional” or “semi-final” may be revised by INS.
The data are annual: INS publishes no monthly series of these events in Tempo. The figures are revised constantly, and the most recent year may still change.