Date oficiale · National Institute of Statistics (INS)
The unemployment rate in Romania
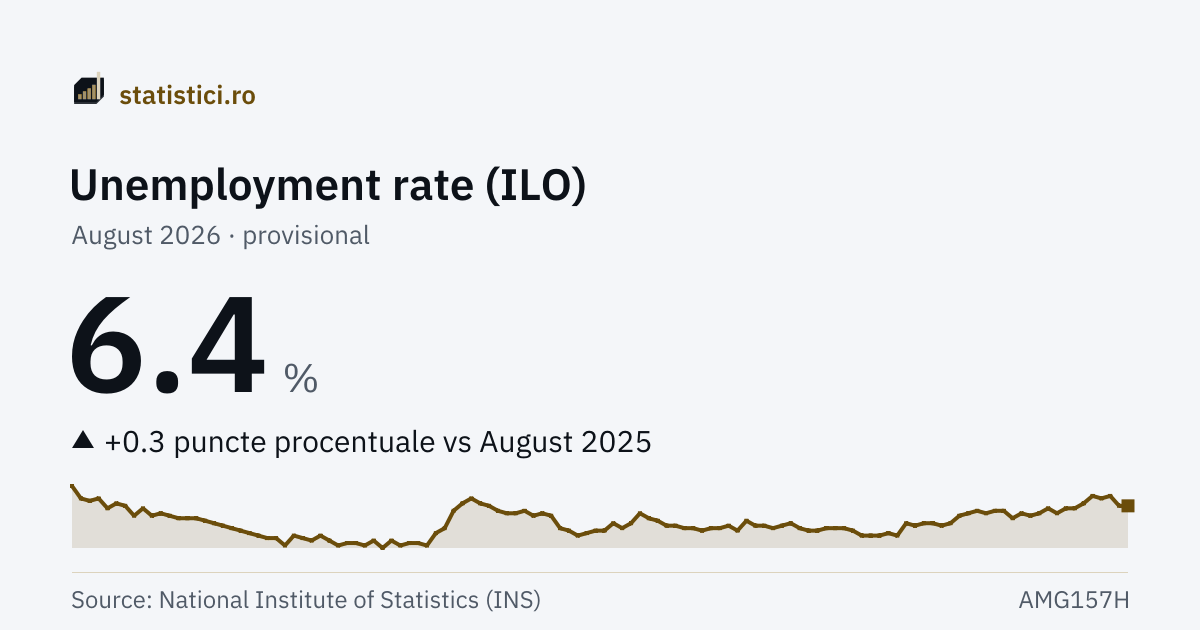
The monthly figures published by National Institute of Statistics (INS), from January 2004 to August 2026.
Unemployment rate (ILO)
6.4 %
August 2026 · provisional
The “Unemployment rate (ILO)” series
- Series high
- 9.6 %June 2013
- Series low
- 4.7 %August 2019
- Months published
- 272since January 2004
Trends
Take this chart
You may use the PNG image or the embedded chart (iframe) on your own site. The iframe updates itself when new data arrive. The attribution and the link to the source are included automatically.
Romania against the European Union
Both figures are the unemployment rate in the ILO sense, seasonally adjusted, published by Eurostat — the same definition on both sides. The figure for Romania coincides with the one INS publishes.
Romania
6.4 %
August 2026
European Union
6.1 %
August 2026
The source of this comparison: Eurostat, August 2026. See the source.
What it means
The unemployment rate is the share of the unemployed in the active population, by the criteria of the International Labour Office (ILO). It is the definition used internationally, which is what makes the figure comparable with other countries'.
It is not the same thing as the registered unemployment rate at the employment agencies. That one counts the people who have entered the records and who meet the legal conditions; the ILO rate counts, through a survey, everybody who has no job, is available to start work and is actively looking. The two figures usually differ a great deal, and the registered rate is appreciably lower.
The survey it rests on, AMIGO, is carried out quarterly, in households. The monthly figures are estimates derived from it by econometric methods, disseminated by INS as provisional data and revised periodically as new information arrives. The series here is the seasonally adjusted one, from which the pattern that repeats year after year has been removed.
The data published for 2004–2008 are not comparable with those that follow; the 2009–2020 stretch was recalculated by INS to reflect the definitions in force from 2021.
History
| Period | Unemployment rate (ILO) |
|---|---|
| August 2026 | 6.4 prov. |
| July 2026 | 6.4 prov. |
| June 2026 | 6.8 |
| May 2026 | 6.7 |
| April 2026 | 6.8 |
| March 2026 | 6.5 |
| February 2026 | 6.3 |
| January 2026 | 6.3 |
| December 2025 | 6.1 |
| November 2025 | 6.3 |
| October 2025 | 6.1 |
| September 2025 | 6.0 |
| August 2025 | 6.1 |
| July 2025 | 5.9 |
| June 2025 | 6.2 |
| May 2025 | 6.2 |
| April 2025 | 6.1 |
| March 2025 | 6.2 |
| February 2025 | 6.1 |
| January 2025 | 6.0 |
| December 2024 | 5.7 |
| November 2024 | 5.6 |
| October 2024 | 5.7 |
| September 2024 | 5.7 |
Year by year
Every year has its own page, with all its periods, the average, the minimum and the maximum.
2026 2025 2024 2023 2022 2021 2020 2019 2018 2017 2016 2015 2014 2013 2012 2011 2010 2009 2008 2007 2006 2005 2004
Source: National Institute of Statistics (INS), matrix AMG157H. Period covered: January 2004 – August 2026. See the source. Figures marked “provisional” or “semi-final” may be revised by INS.
The unemployment rate in the sense of the International Labour Office, a monthly seasonally adjusted series, for people aged 15–74. It is the internationally comparable figure, different from the registered unemployment rate at the employment agencies. The survey it rests on is quarterly, and the monthly figures are estimates which INS revises periodically.