Date oficiale · National Institute of Statistics (INS)
Foreign trade
How much Romania exports and how much it imports in a month, and the gap between them — the trade deficit, which has for years been the economy's largest negative figure.
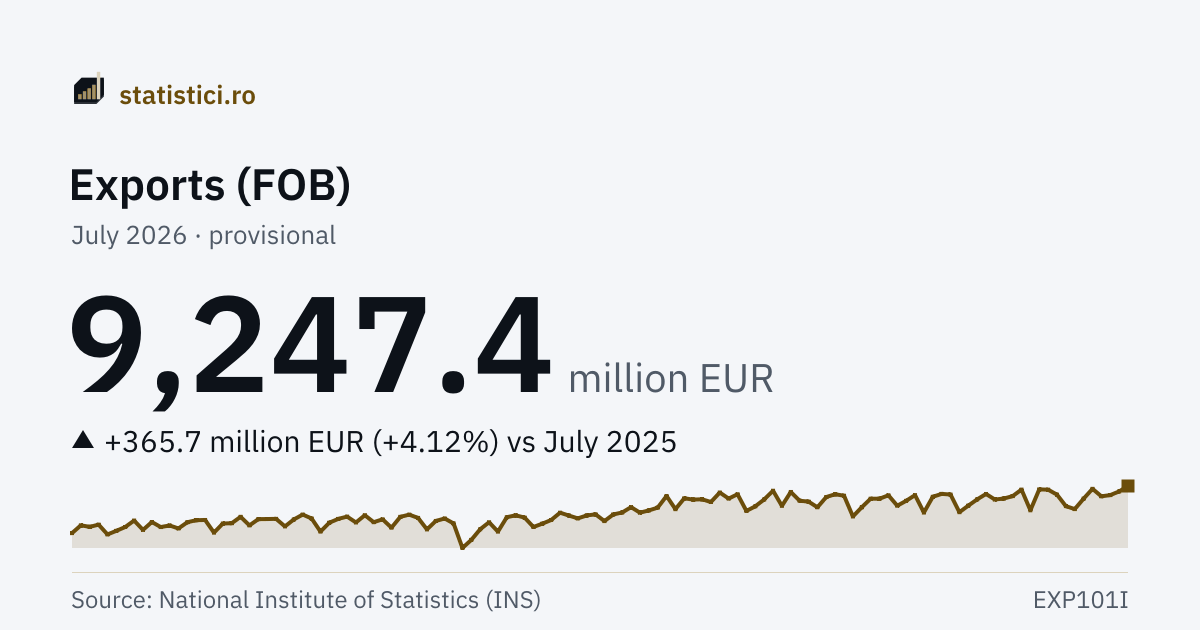
Exports (FOB)
9,247.4 million EUR
July 2026 · provisional
Imports (CIF)
12,069.5 million EUR
July 2026 · provisional
The “Exports (FOB)” series
- Series high
- 9,247.4 million EURJuly 2026 · provisional
- Series low
- 2,931.3 million EURApril 2020
- Months published
- 163since January 2013
Trends
Take this chart
You may use the PNG image or the embedded chart (iframe) on your own site. The iframe updates itself when new data arrive. The attribution and the link to the source are included automatically.
Trade balance
Exports minus imports, month by month. A negative figure means Romania bought more from abroad than it sold.
Trade balance
−2,822.1 million EUR
July 2026 · provisional
Derived figure. Tempo publishes no monthly balance: the figure is the exact subtraction between the two series above, computed by us. Being a FOB/CIF balance, it is more negative than the FOB/FOB balance INS publishes annually.
| Period | Trade balance |
|---|---|
| July 2026 | −2,822.1 prov. |
| June 2026 | −2,947.9 prov. |
| May 2026 | −2,603.7 prov. |
| April 2026 | −3,098.4 prov. |
| March 2026 | −3,020.7 prov. |
| February 2026 | −2,431.0 prov. |
| January 2026 | −2,353.0 prov. |
| December 2025 | −2,687.1 prov. |
| November 2025 | −2,347.3 prov. |
| October 2025 | −3,074.1 prov. |
| September 2025 | −2,513.7 prov. |
| August 2025 | −2,629.6 prov. |
What it means
Exports are valued FOB — “free on board”, that is the value of the goods at the exporting country's border, without the transport and insurance that follow. Imports are valued CIF — “cost, insurance and freight” — which includes the transport and insurance up to the Romanian border. For that reason imports come out systematically higher than the same goods valued as exports would, and the balance computed from them (FOB/CIF) is more negative than the FOB/FOB balance INS publishes annually.
The figures cover trade with all countries, both inside the European Union and outside it. They are provisional monthly data, revised in the following months as late declarations arrive, which means the most recent published month almost always changes.
History
| Period | Exports (FOB) | Imports (CIF) |
|---|---|---|
| July 2026 | 9,247.4 prov. | 12,069.5 prov. |
| June 2026 | 8,691.6 prov. | 11,639.5 prov. |
| May 2026 | 8,321.0 prov. | 10,924.7 prov. |
| April 2026 | 8,197.0 prov. | 11,295.4 prov. |
| March 2026 | 8,958.8 prov. | 11,979.5 prov. |
| February 2026 | 7,958.6 prov. | 10,389.6 prov. |
| January 2026 | 6,895.1 prov. | 9,248.1 prov. |
| December 2025 | 7,196.3 prov. | 9,883.3 prov. |
| November 2025 | 8,365.0 prov. | 10,712.3 prov. |
| October 2025 | 8,872.5 prov. | 11,946.6 prov. |
| September 2025 | 8,903.7 prov. | 11,417.4 prov. |
| August 2025 | 6,771.2 prov. | 9,400.8 prov. |
| July 2025 | 8,881.7 prov. | 11,581.1 prov. |
| June 2025 | 8,216.0 prov. | 10,612.6 prov. |
| May 2025 | 7,970.1 prov. | 10,732.1 prov. |
| April 2025 | 7,868.1 prov. | 11,005.2 prov. |
| March 2025 | 8,435.5 prov. | 11,291.6 prov. |
| February 2025 | 7,884.1 prov. | 10,773.7 prov. |
| January 2025 | 7,243.6 prov. | 9,994.1 prov. |
| December 2024 | 6,578.7 semi-fin. | 9,925.0 semi-fin. |
| November 2024 | 8,379.5 semi-fin. | 11,232.0 semi-fin. |
| October 2024 | 8,443.1 semi-fin. | 12,173.0 semi-fin. |
| September 2024 | 8,147.8 semi-fin. | 10,714.2 semi-fin. |
| August 2024 | 6,542.7 semi-fin. | 9,425.4 semi-fin. |
Year by year
Every year has its own page, with all its periods, the average, the minimum and the maximum.
2026 2025 2024 2023 2022 2021 2020 2019 2018 2017 2016 2015 2014 2013
Source: National Institute of Statistics (INS), matrices EXP101I, EXP102I. Period covered: January 2013 – July 2026. See the source. Figures marked “provisional” or “semi-final” may be revised by INS.
The monthly series begin in January 2013 and come from the matrices by CSCI section, row “Total”. Exports are valued FOB (at the exporting country's border), imports CIF (transport and insurance up to the Romanian border included), so the gap between them is not comparable with a FOB/FOB balance.
Derived figure. INS publishes these monthly series in thousands of euro; the figures here are the same ones divided by a thousand, so that they can be read. The division is exact.