Date oficiale · National Institute of Statistics (INS)
Poverty and inequality
How many people live at risk of poverty or social exclusion in Romania, how many are below the relative poverty line, and how unequally incomes are shared.
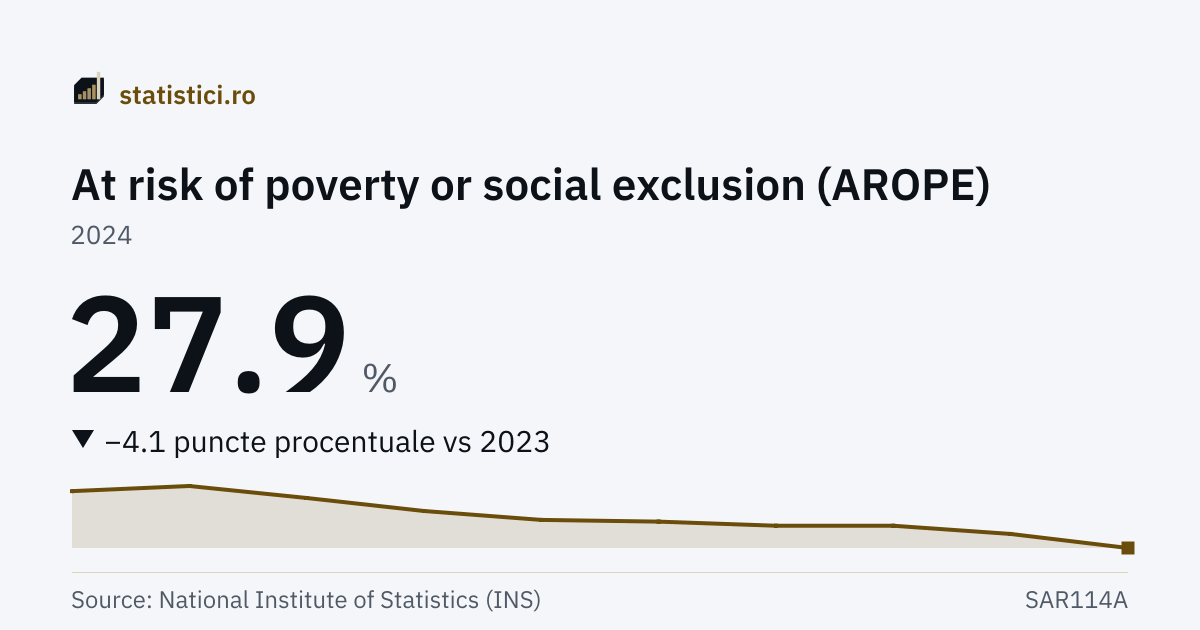
At risk of poverty or social exclusion (AROPE)
27.9 %
2024
Relative poverty rate
19.0 %
2024
The “At risk of poverty or social exclusion (AROPE)” series
- Series high
- 46.0 %2016
- Series low
- 27.9 %2024
- Years published
- 10since 2015
Trends
Take this chart
You may use the PNG image or the embedded chart (iframe) on your own site. The iframe updates itself when new data arrive. The attribution and the link to the source are included automatically.
The Gini coefficient
Income inequality, on a scale from 0 (everybody has the same) to 100 (one person has everything). From the same EU-SILC survey.
The Gini coefficient
28.0 points
2024
| Period | The Gini coefficient |
|---|---|
| 2024 | 28.0 |
| 2023 | 31.0 |
| 2022 | 32.0 |
| 2021 | 34.3 |
| 2020 | 33.8 |
| 2019 | 34.8 |
| 2018 | 35.1 |
| 2017 | 33.1 |
| 2016 | 34.7 |
| 2015 | 37.4 |
| 2014 | 35.0 |
| 2013 | 34.6 |
What it means
The at-risk-of-poverty-or-social-exclusion rate (AROPE) counts the people who are in at least one of three situations: their income is below the relative poverty line, they suffer severe material and social deprivation, or they live in a household with very low work intensity. A person in two or three of them is counted once.
Relative poverty does not measure absolute want but distance from the rest of society: the line is 60% of that year's median equivalised income. If every income rises at the same pace, the rate stays unchanged — and conversely, it can rise in a year when everybody is better off, if the middle of the distribution climbs faster than the bottom.
The Gini coefficient in the panel below measures income inequality on a scale from 0 to 100: zero would mean everybody has exactly the same income, a hundred that a single person has everything. It is computed from the same survey.
History
| Period | At risk of poverty or social exclusion (AROPE) | Relative poverty rate |
|---|---|---|
| 2024 | 27.9 | 19.0 |
| 2023 | 32.0 | 21.1 |
| 2022 | 34.4 | 21.2 |
| 2021 | 34.4 | 22.5 |
| 2020 | 35.6 | 23.4 |
| 2019 | 36.1 | 23.8 |
| 2018 | 38.7 | 23.5 |
| 2017 | 42.5 | 23.6 |
| 2016 | 46.0 | 25.3 |
| 2015 | 44.5 | 25.4 |
| 2014 | – | 25.1 |
| 2013 | – | 23.0 |
| 2012 | – | 22.9 |
| 2011 | – | 22.3 |
| 2010 | – | 21.6 |
| 2009 | – | 22.1 |
| 2008 | – | 23.6 |
| 2007 | – | 24.6 |
Source: National Institute of Statistics (INS), matrices SAR102A, SAR107A, SAR114A. Period covered: 2007 – 2024. See the source.
The data come from the EU-SILC survey on income and living conditions, are annual, and are published with roughly a year's delay. The AROPE series here is the one on the current definition, in use since 2015; INS publishes separately the series on the Europe 2020 Strategy definition, which is not comparable with this one.