Date oficiale · National Institute of Statistics (INS)
The population of Romania
How many people Romania has, on 1 January of each year, by the two measures the National Institute of Statistics publishes — which are not the same thing.
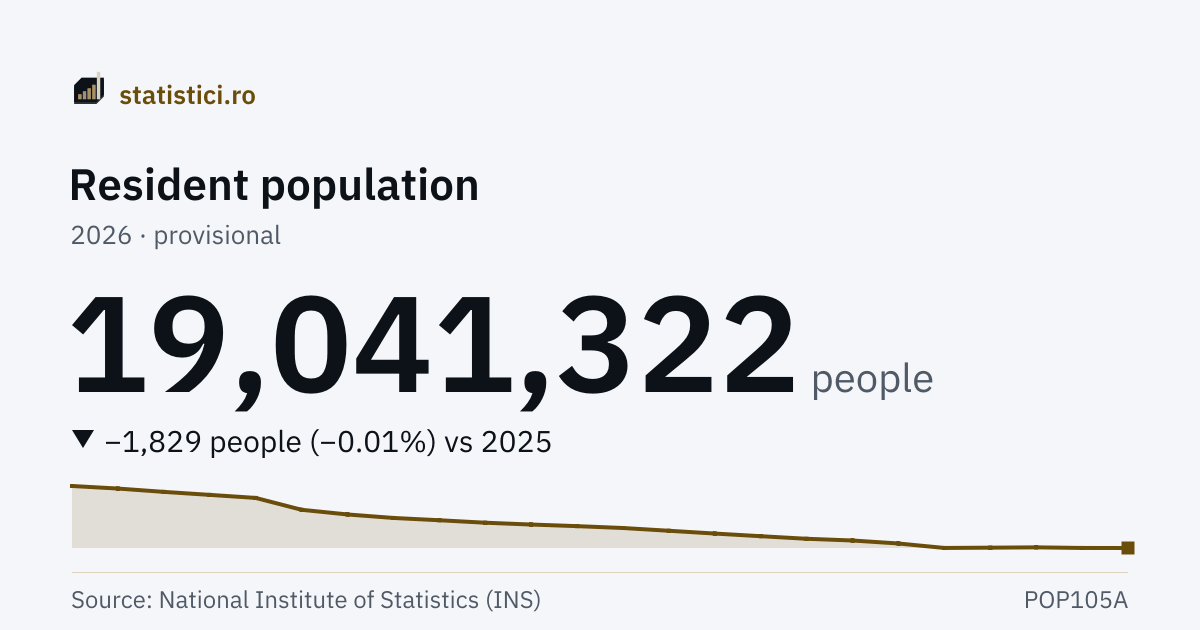
Resident population
19,041,322 people
2026 · provisional
Population by domicile
21,646,220 people
2026
The “Resident population” series
- Series high
- 21,627,509 people2003
- Series low
- 19,041,322 people2026 · provisional
- Years published
- 24since 2003
Trends
Take this chart
You may use the PNG image or the embedded chart (iframe) on your own site. The iframe updates itself when new data arrive. The attribution and the link to the source are included automatically.
Population by urban and rural
The same resident population, split by INS into the urban and the rural environment, on 1 January of each year. The two add up exactly to the figure above, in all twenty-four published years.
Urban
9,792,308 people
2026 · provisional
Rural
9,249,014 people
2026 · provisional
The boundary between urban and rural is not statistical but administrative. Legea 351/2001 ranks the network of localities: rank 0 is the Capital, ranks I–II are municipalities, rank III are towns — all of them urban localities — and ranks IV–V are the villages, that is the rural environment. When a commune is declared a town, a few thousand people move from rural to urban without anybody having moved house.
For that reason the gap between the two lines reads as a change of classification just as well as a movement of people, and over short spans the first explanation is often the right one. The total changes in neither case.
| Period | Urban | Rural |
|---|---|---|
| 2026 | 9,792,308 prov. | 9,249,014 prov. |
| 2025 | 9,770,366 | 9,272,785 |
| 2024 | 9,896,372 | 9,171,918 |
| 2023 | 9,940,807 | 9,114,421 |
| 2022 | 9,959,432 | 9,083,666 |
| 2021 | 10,316,028 | 8,913,491 |
| 2020 | 10,474,555 | 8,879,784 |
| 2019 | 10,463,886 | 8,961,987 |
| 2018 | 10,506,097 | 9,027,384 |
| 2017 | 10,531,819 | 9,112,130 |
| 2016 | 10,636,418 | 9,124,167 |
| 2015 | 10,703,051 | 9,172,491 |
What it means
The resident population is the number of people — Romanian citizens, foreigners and stateless persons — whose usual residence is on the territory of Romania. Usual residence is the place where a person normally spends their daily rest period, and to be counted in a place they must have lived there for at least 12 uninterrupted months before the reference moment. Those who have emigrated are excluded, those who have immigrated are included.
The population by domicile is something else entirely: the number of people with Romanian citizenship and a domicile on the territory of Romania, that is the address on their identity document. Here no account is taken either of the usual residence or of the length or reason of absence from the domicile. A Romanian who left ten years ago stays in this figure and is missing from the other. That is why the two differ by over 2.6 million people, and why the gap grows year by year.
Which of them is “the population of Romania” depends on the question, and INS says so explicitly: for international comparisons only the resident population is used, computed under the European regulations; the population by domicile is used for national purposes, being required by Romanian law, in particular by the law on local public finance. This page's headline figure is the resident one.
The resident population is not counted but estimated: from administrative sources, from data received from the statistical institutes of Spain and Italy, from the Eurostat migration database and from an econometric model for the international migration component, starting from the data of the most recent available census. For 2002–2011 the series was re-estimated to be comparable with the 2011 census.
INS declares no break in the series at the switch to the 2021 census base, but the figures move atypically at that point: between 1 January 2021 and 1 January 2022 the resident population falls by 186,421 people, the largest fall of recent years, and some counties shift by over 7%. The values before and after 2022 are published by INS in the same series, but they are not strictly comparable with one another.
Population by county
The resident population of each county on 1 January, the same measure as the headline figure above. INS publishes the territorial profile only from 2012.
The page has figures for 42 counties of 42. Added up, the 42 counties give 19,041,322 people in 2026, against 19,041,322 people for the country as a whole. The figures match exactly.
| # | county | people |
|---|---|---|
| 1 | Bucharest Municipality | 1,713,832 prov. |
| 2 | Iași | 781,948 prov. |
| 3 | Cluj | 701,564 prov. |
| 4 | Prahova | 683,460 prov. |
| 5 | Timiș | 672,972 prov. |
| 6 | Constanța | 656,512 prov. |
| 7 | Suceava | 648,164 prov. |
| 8 | Ilfov | 619,461 prov. |
| 9 | Dolj | 594,523 prov. |
| 10 | Bacău | 590,169 prov. |
| 11 | Brașov | 564,632 prov. |
| 12 | Argeș | 561,864 prov. |
| 13 | Bihor | 558,623 prov. |
| 14 | Mureș | 519,813 prov. |
| 15 | Galați | 486,387 prov. |
| 16 | Dâmbovița | 475,812 prov. |
| 17 | Maramureș | 451,086 prov. |
| 18 | Neamț | 444,666 prov. |
| 19 | Arad | 410,058 prov. |
| 20 | Sibiu | 396,679 prov. |
| 21 | Buzău | 393,136 prov. |
| 22 | Botoșani | 386,529 prov. |
| 23 | Olt | 372,181 prov. |
| 24 | Vaslui | 363,247 prov. |
| 25 | Hunedoara | 349,011 prov. |
| 26 | Vâlcea | 337,988 prov. |
| 27 | Vrancea | 330,157 prov. |
| 28 | Satu Mare | 330,046 prov. |
| 29 | Alba | 324,901 prov. |
| 30 | Teleorman | 308,440 prov. |
| 31 | Gorj | 306,938 prov. |
| 32 | Bistrița-Năsăud | 298,129 prov. |
| 33 | Harghita | 292,267 prov. |
| 34 | Călărași | 277,347 prov. |
| 35 | Brăila | 269,804 prov. |
| 36 | Giurgiu | 258,793 prov. |
| 37 | Ialomița | 247,409 prov. |
| 38 | Caraș-Severin | 240,283 prov. |
| 39 | Mehedinți | 226,429 prov. |
| 40 | Sălaj | 210,335 prov. |
| 41 | Covasna | 199,596 prov. |
| 42 | Tulcea | 186,131 prov. |
The population of the county seats
MIND THIS, a different measure: at locality level INS publishes no resident population, only the population by domicile — how many people have their identity document registered there, wherever they actually live. The figures here are NOT to be compared with those above and do not add up to the national resident total.
The page has figures for 42 towns of 42.
| # | town | people |
|---|---|---|
| 1 | București | 2,108,049 |
| 2 | Iași | 370,437 |
| 3 | Cluj-Napoca | 324,860 |
| 4 | Timișoara | 292,819 |
| 5 | Constanța | 291,980 |
| 6 | Galați | 288,873 |
| 7 | Brașov | 282,707 |
| 8 | Craiova | 278,599 |
| 9 | Oradea | 212,775 |
| 10 | Ploiești | 205,427 |
| 11 | Bacău | 182,980 |
| 12 | Brăila | 180,124 |
| 13 | Arad | 164,631 |
| 14 | Pitești | 160,262 |
| 15 | Sibiu | 160,228 |
| 16 | Târgu Mureș | 137,273 |
| 17 | Baia Mare | 133,356 |
| 18 | Vaslui | 131,722 |
| 19 | Buzău | 118,200 |
| 20 | Suceava | 115,336 |
| 21 | Râmnicu Vâlcea | 111,574 |
| 22 | Satu Mare | 110,409 |
| 23 | Botoșani | 110,103 |
| 24 | Piatra-Neamț | 104,420 |
| 25 | Drobeta-Turnu Severin | 96,373 |
| 26 | Bistrița | 94,646 |
| 27 | Târgu Jiu | 89,104 |
| 28 | Focșani | 85,334 |
| 29 | Târgoviște | 85,122 |
| 30 | Tulcea | 77,647 |
| 31 | Slatina | 76,456 |
| 32 | Reșița | 76,155 |
| 33 | Alba Iulia | 74,137 |
| 34 | Călărași | 68,519 |
| 35 | Zalău | 66,139 |
| 36 | Deva | 63,068 |
| 37 | Giurgiu | 59,934 |
| 38 | Sfântu Gheorghe | 59,845 |
| 39 | Slobozia | 47,366 |
| 40 | Alexandria | 44,451 |
| 41 | Miercurea Ciuc | 39,358 |
| 42 | Buftea | 23,360 |
History
| Period | Resident population | Population by domicile |
|---|---|---|
| 2026 | 19,041,322 prov. | 21,646,220 |
| 2025 | 19,043,151 | 21,751,865 |
| 2024 | 19,068,290 | 21,849,217 |
| 2023 | 19,055,228 | 21,953,617 |
| 2022 | 19,043,098 | 22,028,486 |
| 2021 | 19,229,519 | 22,138,604 |
| 2020 | 19,354,339 | 22,211,708 |
| 2019 | 19,425,873 | 22,215,217 |
| 2018 | 19,533,481 | 22,221,895 |
| 2017 | 19,643,949 | 22,236,154 |
| 2016 | 19,760,585 | 22,273,309 |
| 2015 | 19,875,542 | 22,312,887 |
| 2014 | 19,953,089 | 22,346,178 |
| 2013 | 20,020,074 | 22,390,978 |
| 2012 | 20,095,996 | 22,433,741 |
| 2011 | 20,199,059 | 22,480,599 |
| 2010 | 20,294,683 | 22,516,004 |
| 2009 | 20,440,290 | 22,541,941 |
| 2008 | 20,635,460 | 22,561,686 |
| 2007 | 21,130,503 | 22,582,773 |
| 2006 | 21,257,016 | 22,614,980 |
| 2005 | 21,382,354 | 22,648,514 |
| 2004 | 21,521,142 | 22,688,392 |
| 2003 | 21,627,509 | 22,733,751 |
Source: National Institute of Statistics (INS), matrices POP105A, POP107A. Period covered: 1992 – 2026. See the source. Figures marked “provisional” or “semi-final” may be revised by INS.
Both figures are as of 1 January. The resident population begins in 2003, the one by domicile in 1992. INS revises these series constantly, and some of the years were recomputed after their first publication; the value shown is already the corrected one, which is why it carries no marking. County figures exist only from 1 January 2012.