Date oficiale · National Institute of Statistics (INS)
The population by domicile of the city of Călărași
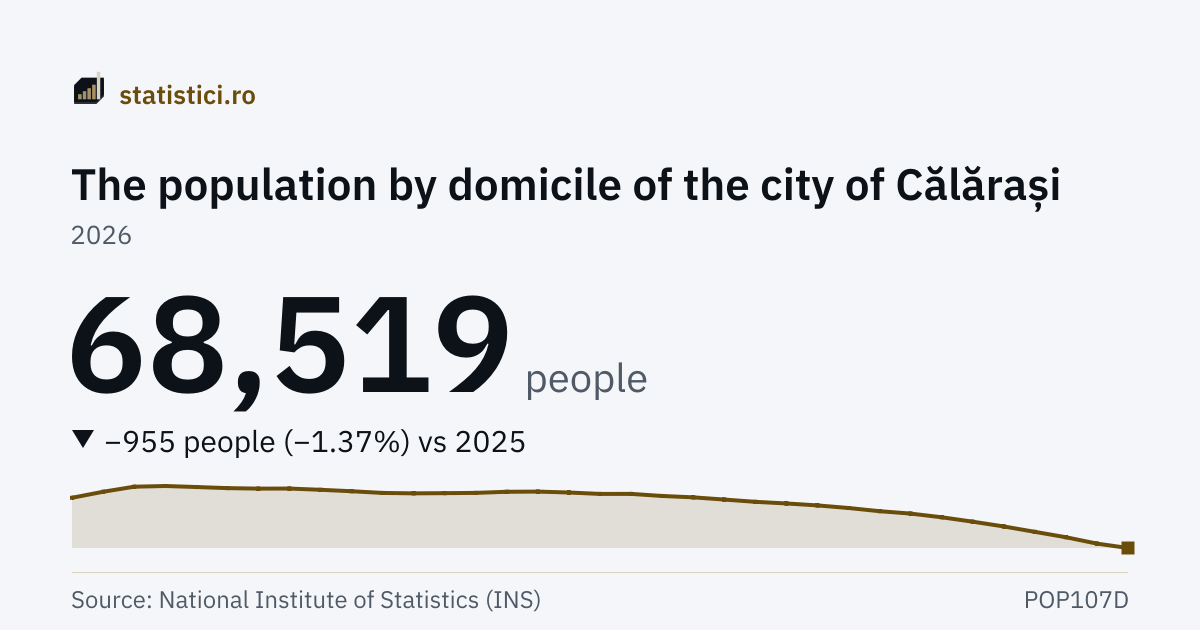
How many people have the address on their identity document in the city of Călărași, on 1 January. It is not the same thing as how many actually live there.
Ranked 34 of 42, in 2026.
Population by domicile
68,519 people
2026
The “Population by domicile” series
- Series high
- 81,990 people1995
- Series low
- 68,519 people2026
- Years published
- 35since 1992
Trends
Take this chart
You may use the PNG image or the embedded chart (iframe) on your own site. The iframe updates itself when new data arrive. The attribution and the link to the source are included automatically.
What it means
The figure on this page is the population BY DOMICILE, not the resident population: the number of people with Romanian citizenship whose identity document gives an address here, wherever they actually live and however long they have been away. The National Institute of Statistics publishes no resident population below county level, so for towns this is the only measure available.
The gap is neither small nor constant. Nationally, the population by domicile is some 2.6 million people larger than the resident one, and the ratio between them differs a great deal from one county to another. A figure here is NOT to be compared with the resident figure on the main page and does not add to it.
The data come from administrative sources — the National Register of Persons for internal migration and permanent immigration, the General Directorate for Passports for emigration — and from the statistical surveys on births and deaths.
The names of the localities are those of the CURRENT administrative-territorial division, applied retroactively: a locality that is a town today appears as a town in the years when it was a commune too.
History
| Period | Population by domicile |
|---|---|
| 2026 | 68,519 |
| 2025 | 69,474 |
| 2024 | 70,861 |
| 2023 | 72,031 |
| 2022 | 73,202 |
| 2021 | 74,238 |
| 2020 | 75,196 |
| 2019 | 75,996 |
| 2018 | 76,518 |
| 2017 | 77,211 |
| 2016 | 77,774 |
| 2015 | 78,196 |
| 2014 | 78,553 |
| 2013 | 79,045 |
| 2012 | 79,525 |
| 2011 | 79,825 |
| 2010 | 80,275 |
| 2009 | 80,270 |
| 2008 | 80,576 |
| 2007 | 80,774 |
| 2006 | 80,735 |
| 2005 | 80,495 |
| 2004 | 80,434 |
| 2003 | 80,393 |
Toate the towns
Alba IuliaAradPiteștiBacăuOradeaBistrițaBotoșaniBrăilaBrașovBuzăuCălărașiReșițaCluj-NapocaConstanțaSfântu GheorgheTârgovișteCraiovaGalațiGiurgiuTârgu JiuMiercurea CiucDevaSloboziaIașiBufteaBaia MareDrobeta-Turnu SeverinBucureștiTârgu MureșPiatra-NeamțSlatinaPloieștiZalăuSatu MareSibiuSuceavaAlexandriaTimișoaraTulceaRâmnicu VâlceaVasluiFocșani
Source: National Institute of Statistics (INS), matrix POP107D. Period covered: 1992 – 2026. See the source.
The figure is the population by DOMICILE on 1 January, not the resident population the main page opens with: INS publishes no resident population below county level anywhere in Tempo. Nationally the two differ by some 2.6 million people and are not to be compared with one another. The series begins in 1992.