Date oficiale · National Institute of Statistics (INS)
The real wage
How much the average net wage has grown against the same month of the previous year once the rise in prices is taken out — and what past wages would be worth in today's money.
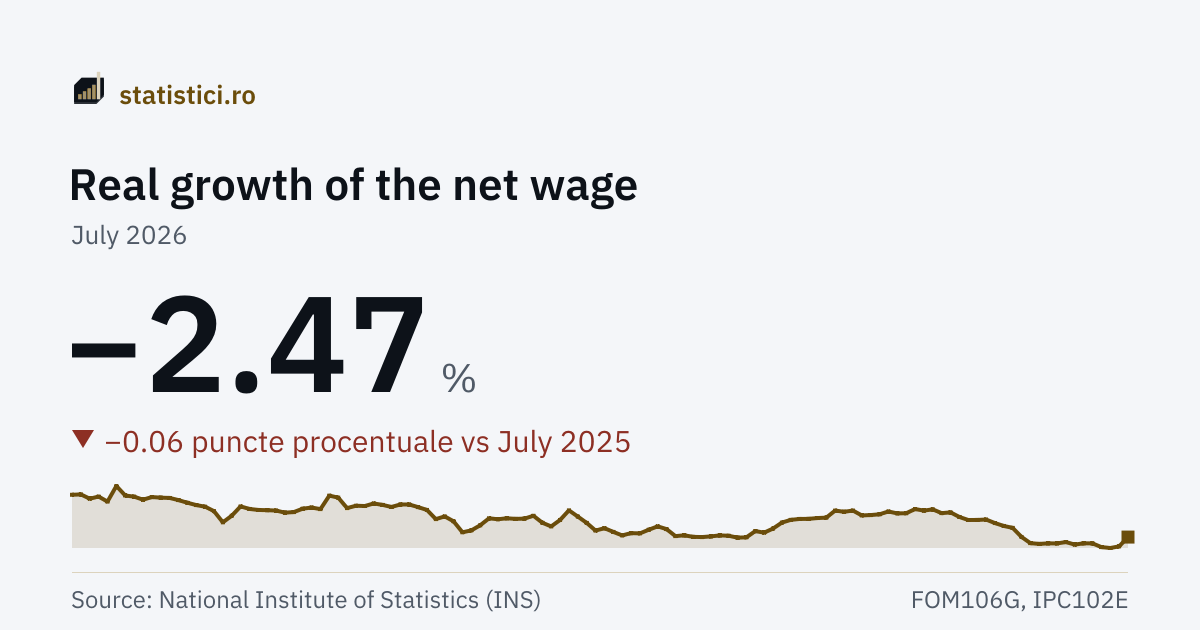
Real growth of the net wage
−2.47 %
July 2026
The “Real growth of the net wage” series
- Series high
- 23.58 %December 2006
- Series low
- −9.66 %October 2010
- Months published
- 307since January 2001
Trends
Take this chart
You may use the PNG image or the embedded chart (iframe) on your own site. The iframe updates itself when new data arrive. The attribution and the link to the source are included automatically.
The net wage in today's prices
Every monthly wage from 2000 onwards, expressed in the prices of the most recent published month: what that money would be worth today. The last month equals the nominal wage, because it is the base.
The net wage, in the current month's prices
5,820 lei/month
July 2026
Derived figure. That month's nominal wage, multiplied by the ratio between the price level of the most recent month and that of the month in question. The price level is built from the INS index against December of the previous year (IPC102B), chained through the December links.
| Period | The net wage, in the current month's prices |
|---|---|
| July 2026 | 5,820 |
| June 2026 | 5,767 |
| May 2026 | 5,720 |
| April 2026 | 5,914 |
| March 2026 | 6,061 |
| February 2026 | 5,716 |
| January 2026 | 5,710 |
| December 2025 | 6,172 |
| November 2025 | 5,873 |
| October 2025 | 5,769 |
| September 2025 | 5,746 |
| August 2025 | 5,707 |
What it means
The real wage answers the question “could I afford more or less than last year?”. The nominal wage — the one on the payslip — can rise while purchasing power falls, if prices rise faster. This page's headline figure is exactly the difference between the two: the growth of the net wage with the growth of prices taken out, month by month, against the same month of the previous year.
A negative figure is not a cut in wages: the nominal wage can rise, but more slowly than prices. And conversely, real growth does not mean everybody earns more — the average wage is an arithmetic mean, so more than half of employees earn below it, and the basket inflation is measured against is an average one, with weights fixed two years earlier. A household that spends differently from the average feels a different inflation and therefore a different purchasing power.
The panel below tells the same story as a level rather than a rate: every past wage expressed in the prices of the most recent published month. The last month is, by construction, equal to that month's nominal wage — it is where the recomputation starts. When INS publishes a new month, the whole series is recomputed in its prices, so the historical values change by a few lei; the series is not being revised, it is being expressed in a different measuring unit.
Prices are carried from one month to the next through the index INS publishes against December of the previous year (IPC102B): inside a year it is that month's own value, and from year to year the links are the December ones. The chain thus has one link per year, not twelve. Checked against the annual index INS publishes separately, the two versions of the same price history diverge by 0.004% at the median and by 0.111% at worst, over 295 months — the rounding of the two published decimals. The real growth at the top uses no chain at all: it divides directly by the published annual index, so it carries no chaining error.
History
| Period | Real growth of the net wage |
|---|---|
| July 2026 | −2.47 |
| June 2026 | −6.25 |
| May 2026 | −6.91 |
| April 2026 | −6.54 |
| March 2026 | −5.03 |
| February 2026 | −5.00 |
| January 2026 | −5.52 |
| December 2025 | −4.49 |
| November 2025 | −5.05 |
| October 2025 | −5.02 |
| September 2025 | −5.25 |
| August 2025 | −4.93 |
| July 2025 | −2.41 |
| June 2025 | 1.28 |
| May 2025 | 2.06 |
| April 2025 | 3.24 |
| March 2025 | 4.67 |
| February 2025 | 4.50 |
| January 2025 | 4.48 |
| December 2024 | 5.71 |
| November 2024 | 7.58 |
| October 2024 | 7.27 |
| September 2024 | 8.80 |
| August 2024 | 8.31 |
Year by year
Every year has its own page, with all its periods, the average, the minimum and the maximum.
2026 2025 2024 2023 2022 2021 2020 2019 2018 2017 2016 2015 2014 2013 2012 2011 2010 2009 2008 2007 2006 2005 2004 2003 2002 2001
Source: National Institute of Statistics (INS), matrices FOM106D, FOM106G, IPC102B, IPC102E. Period covered: January 2000 – July 2026. See the source.
Both series it is computed from are INS's: the average net wage (matrices FOM106D and FOM106G) and the consumer price indices (IPC102E for the real growth, IPC102B for expressing wages in today's prices). The arithmetic is ours and is written out below; the input figures are untouched.
Derived figure. The figure is published by nobody: we compute it, from two series INS publishes separately. A month's real growth is the growth of the net wage against the same month of the previous year, divided by the consumer price index of that month against the same month of the previous year (IPC102E), minus one. In July 2026, for instance, the net wage grew by 5.49% and prices by 8.16%, so the real wage fell: 1.0549 ÷ 1.0816 − 1 = −2.47%.