Date oficiale · National Institute of Statistics (INS)
The population of Olt County
The resident population of Olt County on 1 January, published by the National Institute of Statistics.
Ranked 23 of 42, in 2026.
Resident population
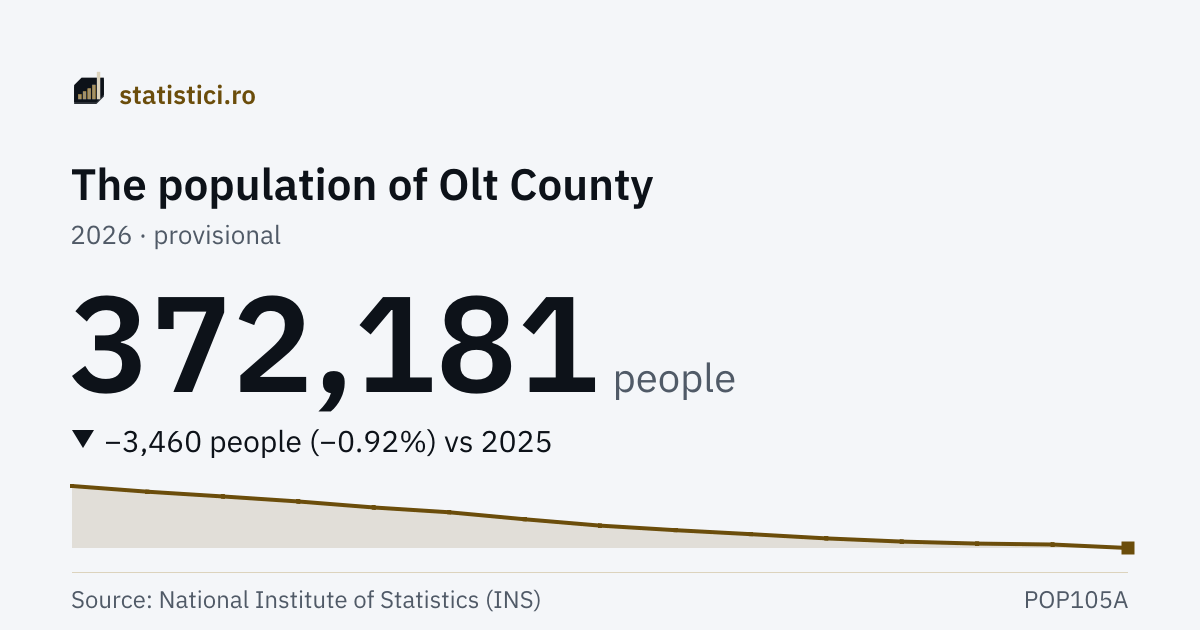
372,181 people
2026 · provisional
The “Resident population” series
- Series high
- 433,839 people2012
- Series low
- 372,181 people2026 · provisional
- Years published
- 15since 2012
Trends
Take this chart
You may use the PNG image or the embedded chart (iframe) on your own site. The iframe updates itself when new data arrive. The attribution and the link to the source are included automatically.
What it means
The figure is the county's resident population on 1 January: the people whose usual residence is here, whatever their citizenship, not those whose identity document gives this address. The same measure as the national one, but published by county only from 2012.
The resident population is not counted but estimated — from administrative sources, from data received from other states' statistical institutes and from the census. That is why INS recomputes years already published, and why a year's figure may differ from what you saw last year.
The 42 counties add up exactly to the national total, and the site checks that at every import. The Municipality of Bucharest appears in the list at county level because that is how INS publishes it, although it is not a county.
By urban and rural
The same resident population, split by INS into the urban and the rural environment, on 1 January of each year. The two add up exactly to the figure above, in every published year.
Urban
148,048 people
2026 · provisional
Rural
224,133 people
2026 · provisional
The boundary between urban and rural is administrative, not statistical: Legea 351/2001 puts the municipalities and the towns in the urban half and the villages in the rural one. When a commune is declared a town, a few thousand people move from one line to the other without anybody having moved house, and over short spans that explains a change more often than a real migration does. The total changes in neither case.
| Period | Urban | Rural |
|---|---|---|
| 2026 | 148,048 prov. | 224,133 prov. |
| 2025 | 146,191 | 229,450 |
| 2024 | 150,094 | 226,473 |
| 2023 | 150,918 | 227,649 |
| 2022 | 151,637 | 230,094 |
| 2021 | 150,201 | 235,734 |
| 2020 | 155,273 | 234,633 |
| 2019 | 155,670 | 238,778 |
| 2018 | 157,229 | 243,534 |
| 2017 | 157,523 | 250,194 |
| 2016 | 161,197 | 251,294 |
| 2015 | 163,423 | 255,040 |
History
| Period | Resident population |
|---|---|
| 2026 | 372,181 prov. |
| 2025 | 375,641 |
| 2024 | 376,567 |
| 2023 | 378,567 |
| 2022 | 381,731 |
| 2021 | 385,935 |
| 2020 | 389,906 |
| 2019 | 394,448 |
| 2018 | 400,763 |
| 2017 | 407,717 |
| 2016 | 412,491 |
| 2015 | 418,463 |
| 2014 | 423,445 |
| 2013 | 428,160 |
| 2012 | 433,839 |
Toate the counties
AlbaAradArgeșBacăuBihorBistrița-NăsăudBotoșaniBrăilaBrașovBuzăuCălărașiCaraș-SeverinClujConstanțaCovasnaDâmbovițaDoljGalațiGiurgiuGorjHarghitaHunedoaraIalomițaIașiIlfovMaramureșMehedințiBucharest MunicipalityMureșNeamțOltPrahovaSălajSatu MareSibiuSuceavaTeleormanTimișTulceaVâlceaVasluiVrancea
Source: National Institute of Statistics (INS), matrix POP105A. Period covered: 2012 – 2026. See the source. Figures marked “provisional” or “semi-final” may be revised by INS.
The figure is the resident population on 1 January, the same measure as the national one. By county, however, INS publishes it only from 1 January 2012, although the national series begins in 2003. Some of the years in the series were recomputed by INS after their first publication; the value shown is already the corrected one, which is why it carries no marking.