Date oficiale · National Institute of Statistics (INS)
Births and deaths in Galați County
How many children are born and how many people die each year in Galați County, the natural increase and the rates per 1,000 inhabitants, according to the data of the National Institute of Statistics.
Ranked 17 of 42, in 2025.
Live births
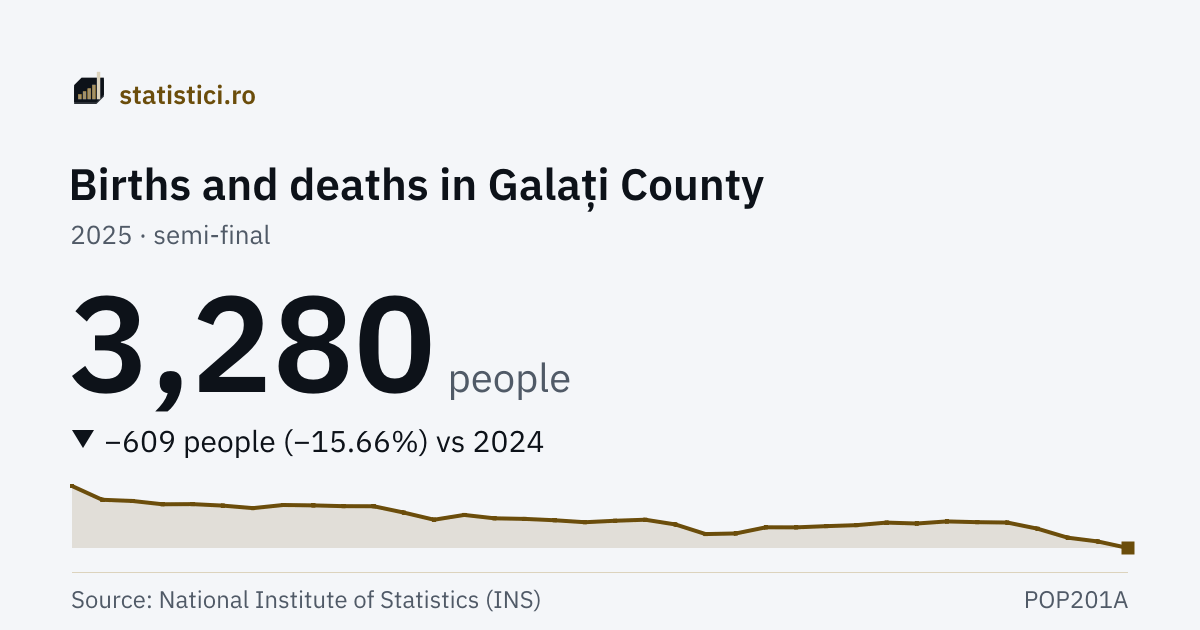
3,280 people
2025 · semi-final
Deaths
6,659 people
2025 · semi-final
The “Live births” series
- Series high
- 9,053 people1990
- Series low
- 3,280 people2025 · semi-final
- Years published
- 36since 1990
Trends
Take this chart
You may use the PNG image or the embedded chart (iframe) on your own site. The iframe updates itself when new data arrive. The attribution and the link to the source are included automatically.
What it means
Counties are not assigned by where the event happened but by where the person lived, and INS says so in the methodology of each matrix: births are assigned “by the domicile or usual residence of the mother (parent) or the legal representative”, deaths “by the last domicile or last usual residence of the deceased”. A county with a large maternity hospital therefore does not receive the births of women coming from neighbouring counties, and a death in a hospital in another county is counted at home.
The scope changed in 2012, as it did for the national figures: until 2011 it covered people domiciled in Romania, from 2012 also those with their usual residence here. The series carries no break declared by INS, but the two halves do not count exactly the same people.
The figures of a recent year RISE after publication. INS explains the mechanism: a revised figure for year T also covers the events that happened in year T but were registered late, in years T+1, T+2 and the first four months of T+3. The most recent year on the page is therefore the most incomplete, and the marking beside the figure says what stage it is at.
The 42 counties add up exactly to the national figure, in every one of the 36 published years, for births, for deaths and for the increase. Rates are neither added nor averaged: a rate has no total.
Natural increase
The difference between the number of live births and the number of deaths in the year. It is the figure INS publishes, not a subtraction of ours.
Natural increase
−3,379 people
2025 · semi-final
| Period | Natural increase |
|---|---|
| 2025 | −3,379 semi-fin. |
| 2024 | −2,904 |
| 2023 | −2,592 |
| 2022 | −2,392 |
| 2021 | −3,380 |
| 2020 | −2,291 |
| 2019 | −1,608 |
| 2018 | −1,878 |
| 2017 | −1,656 |
| 2016 | −1,592 |
| 2015 | −1,583 |
| 2014 | −1,625 |
Per 1,000 inhabitants
The birth rate and the death rate, as published by INS: the number of live births and the number of deaths in the year, divided by the population on 1 July of the same year. These are the figures that make two counties of different sizes comparable — a rate is neither added nor averaged with others, so it has no "country total" that could be obtained from the 42.
Birth rate
5.3 per 1,000 inhabitants
2025 · provisional
Death rate
10.8 per 1,000 inhabitants
2025 · provisional
The denominator is the population by domicile on 1 July, not the resident population. INS says what goes into it: "the number of people with Romanian citizenship and a domicile on the territory of Romania", and "no account is taken of the usual residence, of the length and/or the reason for absence from the domicile". Anybody who has left the country with a declared domicile here therefore stays in the denominator: nationally, 21.6 million by domicile against 19.0 million residents. A larger denominator gives a smaller rate, so the rates here are below those that would be obtained by dividing by the population actually living in the county — all the more so in the counties many have left.
The rates for 1990 and 1991 are computed by INS on a different population source from those that follow: from 1992 onwards they were recomputed after the indicator "population by domicile on 1 July" was disseminated, while for the first two years the long historical population series were used.
| Period | Birth rate | Death rate |
|---|---|---|
| 2025 | 5.3 prov. | 10.8 prov. |
| 2024 | 6.3 | 10.9 |
| 2023 | 6.5 | 10.9 |
| 2022 | 8.0 | 11.8 |
| 2021 | 9.0 | 14.3 |
| 2020 | 9.0 | 12.6 |
| 2019 | 9.1 | 11.7 |
| 2018 | 8.8 | 11.8 |
| 2017 | 9.0 | 11.6 |
| 2016 | 8.6 | 11.1 |
| 2015 | 8.4 | 10.9 |
| 2014 | 8.2 | 10.7 |
History
| Period | Live births | Deaths |
|---|---|---|
| 2025 | 3,280 semi-fin. | 6,659 semi-fin. |
| 2024 | 3,889 | 6,793 |
| 2023 | 4,242 | 6,834 |
| 2022 | 5,079 | 7,471 |
| 2021 | 5,651 | 9,031 |
| 2020 | 5,685 | 7,976 |
| 2019 | 5,756 | 7,364 |
| 2018 | 5,561 | 7,439 |
| 2017 | 5,645 | 7,301 |
| 2016 | 5,407 | 6,999 |
| 2015 | 5,315 | 6,898 |
| 2014 | 5,202 | 6,827 |
| 2013 | 5,208 | 6,540 |
| 2012 | 4,634 | 6,725 |
| 2011 | 4,577 | 6,402 |
| 2010 | 5,473 | 6,911 |
| 2009 | 5,913 | 6,697 |
| 2008 | 5,817 | 6,638 |
| 2007 | 5,680 | 6,556 |
| 2006 | 5,863 | 6,426 |
| 2005 | 5,991 | 6,596 |
| 2004 | 6,044 | 6,466 |
| 2003 | 6,359 | 6,858 |
| 2002 | 5,912 | 6,879 |
Toate the counties
AlbaAradArgeșBacăuBihorBistrița-NăsăudBotoșaniBrăilaBrașovBuzăuCălărașiCaraș-SeverinClujConstanțaCovasnaDâmbovițaDoljGalațiGiurgiuGorjHarghitaHunedoaraIalomițaIașiIlfovMaramureșMehedințiBucharest MunicipalityMureșNeamțOltPrahovaSălajSatu MareSibiuSuceavaTeleormanTimișTulceaVâlceaVasluiVrancea
Source: National Institute of Statistics (INS), matrices POP201A, POP202A, POP206B, POP207A, POP214A. Period covered: 1990 – 2025. See the source. Figures marked “provisional” or “semi-final” may be revised by INS.
The data are annual and refer to the events registered at the civil registry offices in Romania, assigned to counties by the domicile or usual residence of the mother, respectively by the last domicile of the deceased. The figures are revised constantly: a recent year is filled in with the late registrations of the following three years, so it may rise. The rates per 1,000 inhabitants come from matrices POP202A and POP207A, with the population by domicile on 1 July as the denominator.