Date oficiale · National Institute of Statistics (INS)
Average wage in public administration and defence
Average net and gross earnings in public administration and defence, month by month, published by the National Institute of Statistics.
Ranked 4 of 11, in July 2026.
Average net wage
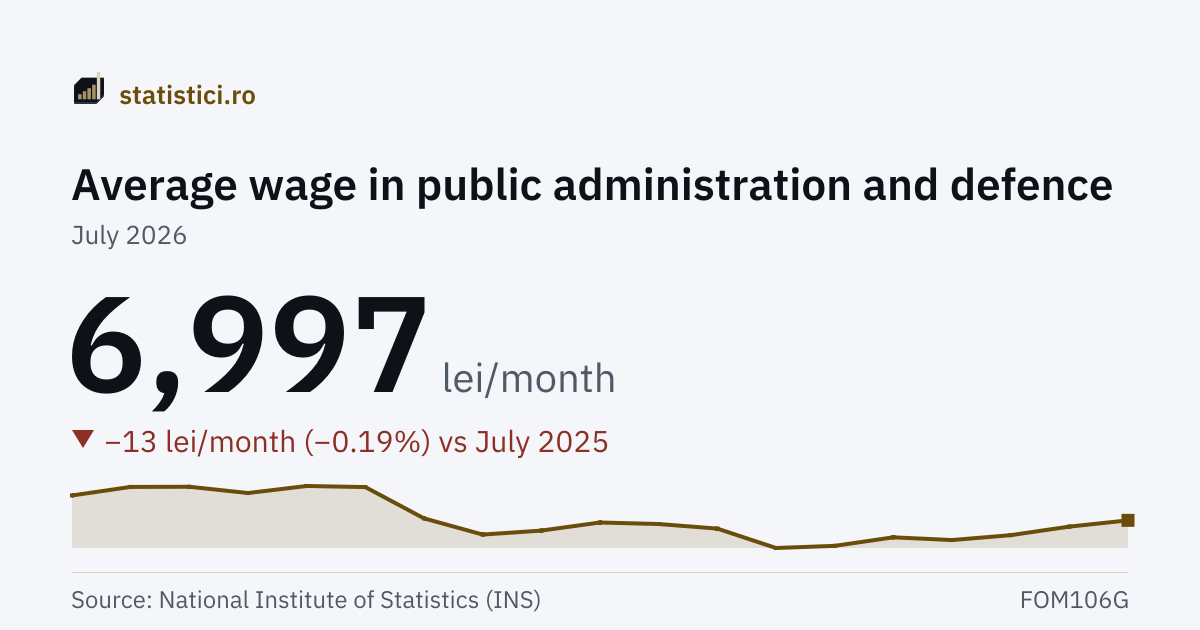
6,997 lei/month
July 2026
Average gross wage
11,831 lei/month
July 2026
The “Average net wage” series
- Series high
- 7,222 lei/monthMay 2025
- Series low
- 6,816 lei/monthJanuary 2026
- Months published
- 19since January 2025
Trends
Take this chart
You may use the PNG image or the embedded chart (iframe) on your own site. The iframe updates itself when new data arrive. The attribution and the link to the source are included automatically.
What it means
The figure is the average monthly earning of one employee in this activity, computed by INS from a monthly statistical survey. It is an arithmetic mean, not a typical wage: high salaries pull it up, so more than half of the employees in the activity earn less than this figure.
Units are classified by the employer's HOMOGENEOUS activity, not by each employee's occupation. A programmer employed by a bank counts under financial services, not under IT; a hospital kitchen counts under health, not under restaurants.
Net pay is obtained by subtracting the employee's compulsory contributions from gross pay. The figure excludes severance payments and sums paid retroactively under court rulings for earlier years.
Averages by activity do NOT add up to the national average and cannot be averaged together: the national figure is a mean weighted by the number of employees, and the weights are not published in these matrices.
The history under CANE Rev.2 (2000–2025)
The same activity, read from the matrix INS closed in december 2025, under the CANE Rev.2 classification. It is a separate series, not the continuation of the one above: the two nomenclatures do not join and are not drawn on one chart. Net and gross both match to the leu in all twelve shared months. Under Rev.2 this activity carried a different section letter, which is why matching by letter across the break would join two unrelated things. A match in 2025 does not prove the scope was the same earlier, though: INS says the 2025 months were estimated into Rev.3 through a conversion matrix, so they are the same source recoded. Only a MISmatch proves anything — namely that the scope moved.
Average net wage (CAEN Rev.2)
6,943 lei/month
December 2025
Average gross wage (CAEN Rev.2)
11,751 lei/month
December 2025
The months from January 2000 to December 2008 were not collected under CANE Rev.2. INS writes in the matrix methodology that they were estimated, through a conversion matrix, from data collected under CANE Rev.1. That is the first nine years out of twenty-six, and no step shows in the data at the join — but the absence of a step is not evidence of measurement.
The gross line crosses the January 2018 break and is not comparable across it. Under Emergency Ordinance 79/2017 the social security and health contributions that used to be paid by the employer passed to the employee and have been reflected in gross pay ever since; INS writes that the indicator "is no longer comparable with the data series prior to 2018". Here gross jumps +49.7% from one month to the next, and the net-to-gross ratio falls from about 0.72 to about 0.60 and stays there. Net does NOT have this break, and INS says so explicitly.
Severance payments are not included, nor sums paid retroactively after court rulings on entitlements for earlier years. The figures come from a sample of about 24,200 units, not from a complete count.
| Period | Average net wage (CAEN Rev.2) | Average gross wage (CAEN Rev.2) |
|---|---|---|
| December 2025 | 6,943 | 11,751 |
| November 2025 | 6,973 | 11,798 |
| October 2025 | 6,983 | 11,817 |
| September 2025 | 6,930 | 11,727 |
| August 2025 | 6,904 | 11,687 |
| July 2025 | 7,010 | 11,862 |
| June 2025 | 7,215 | 12,211 |
| May 2025 | 7,222 | 12,225 |
| April 2025 | 7,176 | 12,153 |
| March 2025 | 7,217 | 12,215 |
| February 2025 | 7,216 | 12,219 |
| January 2025 | 7,160 | 12,131 |
History
| Period | Average net wage | Average gross wage |
|---|---|---|
| July 2026 | 6,997 | 11,831 |
| June 2026 | 6,956 | 11,767 |
| May 2026 | 6,900 | 11,685 |
| April 2026 | 6,868 | 11,638 |
| March 2026 | 6,886 | 11,668 |
| February 2026 | 6,830 | 11,572 |
| January 2026 | 6,816 | 11,545 |
| December 2025 | 6,943 | 11,751 |
| November 2025 | 6,973 | 11,798 |
| October 2025 | 6,983 | 11,817 |
| September 2025 | 6,930 | 11,727 |
| August 2025 | 6,904 | 11,687 |
| July 2025 | 7,010 | 11,862 |
| June 2025 | 7,215 | 12,211 |
| May 2025 | 7,222 | 12,225 |
| April 2025 | 7,176 | 12,153 |
| March 2025 | 7,217 | 12,215 |
| February 2025 | 7,216 | 12,219 |
| January 2025 | 7,160 | 12,131 |
Toate the activities
IT (programming and consultancy)Telecoms and IT (section K)ManufacturingConstructionWholesale and retail tradeTransport and storageHotels and restaurantsFinancial services and insurancePublic administration and defenceEducationHealth and social work
Source: National Institute of Statistics (INS), matrices FOM106D, FOM106G, FOM107D, FOM107G. Period covered: January 2000 – July 2026. See the source.
The figures are on CANE Rev.3 and begin in January 2025, when INS opened the matrix under the new classification. They are not comparable with an activity of the same name from before 2025: at the move to Rev.3 the section letters were reassigned, and some units moved from one section to another. Where an honest counterpart exists under CANE Rev.2, its history is in the separate block above, with the break declared — never spliced onto the line here.