Date oficiale · National Institute of Statistics (INS)
Building permits in Vrancea County
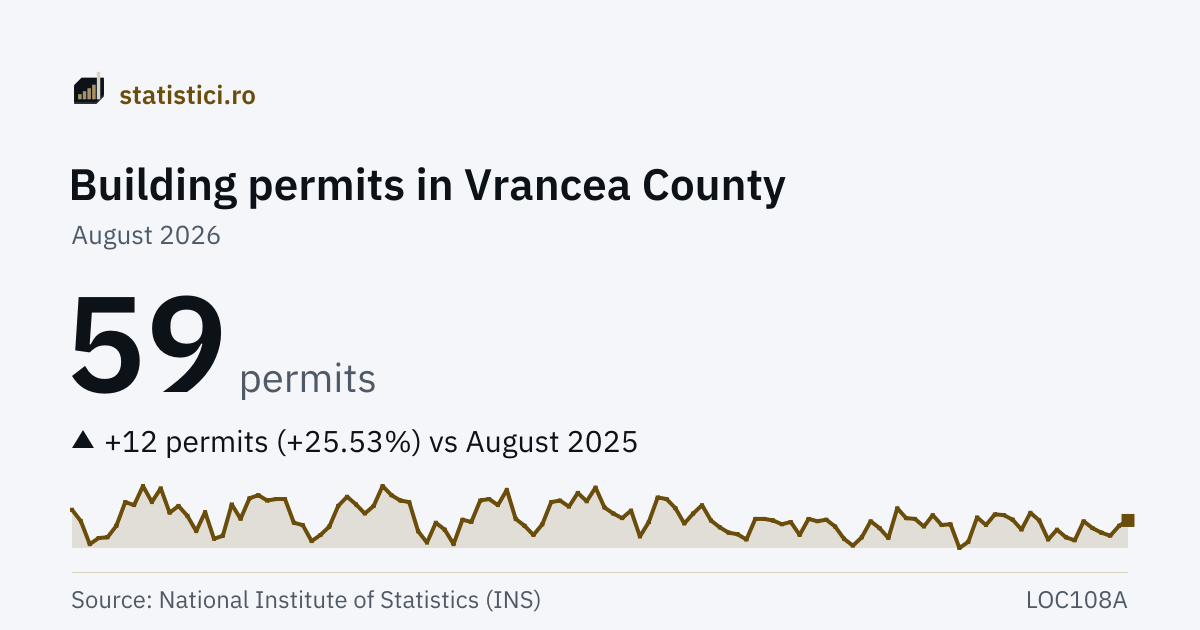
How many building permits for residential buildings are issued each month in Vrancea County.
Ranked 20 of 42, in August 2026.
Building permits
59 permits
August 2026
The “Building permits” series
- Series high
- 583 permitsDecember 2005
- Series low
- 23 permitsJanuary 2025
- Months published
- 296since January 2002
Trends
Take this chart
You may use the PNG image or the embedded chart (iframe) on your own site. The iframe updates itself when new data arrive. The attribution and the link to the source are included automatically.
What it means
A building permit is the act of the local administration on the basis of which the rules on the siting, design, execution and operation of constructions are applied. It is issued with a view to the START of the works, so their number says what is intended to be built, not what was built.
The forms are filled in by the prefectures and by the county and local councils. The figures here are for residential buildings, excluding those for communities, and they also cover extensions to existing residential buildings.
A county's figures are small, so the change from one month to the next is large by chance: a few permits more or fewer move the percentage a great deal. The comparison that says something is the one with the same month of the previous year, because the series is strongly seasonal — construction is authorised in summer.
The 42 counties add up exactly to the national figure, checked at every import.
History
| Period | Building permits |
|---|---|
| August 2026 | 59 |
| July 2026 | 52 |
| June 2026 | 39 |
| May 2026 | 43 |
| April 2026 | 49 |
| March 2026 | 58 |
| February 2026 | 33 |
| January 2026 | 37 |
| December 2025 | 47 |
| November 2025 | 34 |
| October 2025 | 59 |
| September 2025 | 69 |
| August 2025 | 47 |
| July 2025 | 60 |
| June 2025 | 66 |
| May 2025 | 67 |
| April 2025 | 53 |
| March 2025 | 63 |
| February 2025 | 31 |
| January 2025 | 23 |
| December 2024 | 54 |
| November 2024 | 53 |
| October 2024 | 66 |
| September 2024 | 51 |
Toate the counties
AlbaAradArgeșBacăuBihorBistrița-NăsăudBotoșaniBrăilaBrașovBuzăuCălărașiCaraș-SeverinClujConstanțaCovasnaDâmbovițaDoljGalațiGiurgiuGorjHarghitaHunedoaraIalomițaIașiIlfovMaramureșMehedințiBucharest MunicipalityMureșNeamțOltPrahovaSălajSatu MareSibiuSuceavaTeleormanTimișTulceaVâlceaVasluiVrancea
Source: National Institute of Statistics (INS), matrix LOC108A. Period covered: January 2002 – August 2026. See the source.
The series is for residential buildings, excluding those for communities. Unlike the national figure, which is published unbroken across all 295 months, a county may have months with no published figure at all — the chart breaks there, no line is drawn across. The series is strongly seasonal, so the comparison that says something is the one with the same month of the previous year.