Date oficiale · National Institute of Statistics (INS)
Tourism in Vrancea County
How many tourists arrive each month in Vrancea County and how many nights they spend there, according to the data of the National Institute of Statistics.
Ranked 34 of 42, in July 2026.
Arrivals
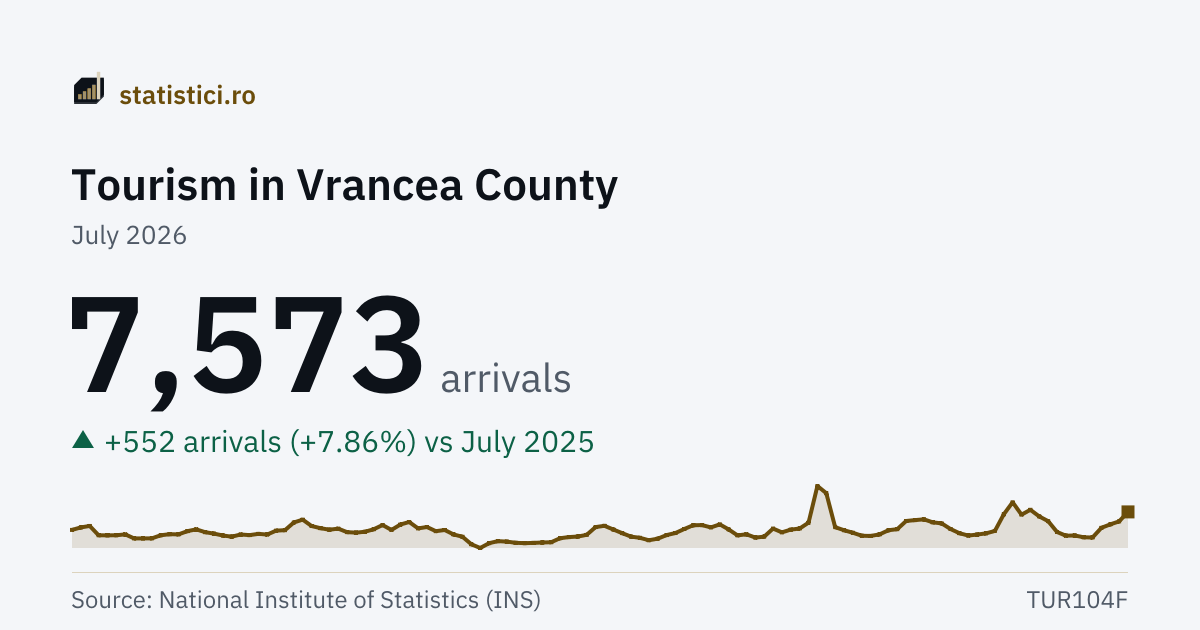
7,573 arrivals
July 2026
Overnight stays
15,311 overnight stays
July 2026
The “Arrivals” series
- Series high
- 12,743 arrivalsAugust 2023
- Series low
- 366 arrivalsJune 2020
- Months published
- 197since January 2010
Trends
Take this chart
You may use the PNG image or the embedded chart (iframe) on your own site. The iframe updates itself when new data arrive. The attribution and the link to the source are included automatically.
What it means
An “arrival” is a check-in, not a distinct person: somebody who checks in twice in the same month is counted twice. An “overnight stay” is a night spent by one person at an accommodation establishment, so the ratio between the two shows how long people stay in the county.
The monthly figures come only from establishments with at least 10 bed-places. INS's annual survey goes down to 5 bed-places and therefore covers more units: the annual figure INS publishes is larger than the sum of the twelve months here.
In April and May 2020, under the state of emergency, some counties have no published figure at all. They are shown as missing, not as zero, because INS does not say which of the two it is — and the chart breaks there.
From 2021 the figures also include tourists staying in apartments and rooms to let, and INS revised only 2021 and 2022 for it. A month after 2021 does not measure the same basket as one before it.
History
| Period | Arrivals | Overnight stays |
|---|---|---|
| July 2026 | 7,573 | 15,311 |
| June 2026 | 5,676 | 9,576 |
| May 2026 | 5,084 | 8,020 |
| April 2026 | 4,388 | 7,359 |
| March 2026 | 2,460 | 3,389 |
| February 2026 | 2,506 | 3,185 |
| January 2026 | 2,867 | 3,751 |
| December 2025 | 2,822 | 3,894 |
| November 2025 | 3,566 | 5,099 |
| October 2025 | 5,726 | 8,852 |
| September 2025 | 6,668 | 10,863 |
| August 2025 | 7,991 | 16,622 |
| July 2025 | 7,021 | 12,721 |
| June 2025 | 9,496 | 12,918 |
| May 2025 | 7,087 | 10,417 |
| April 2025 | 3,769 | 7,125 |
| March 2025 | 3,289 | 4,639 |
| February 2025 | 3,045 | 3,934 |
| January 2025 | 2,850 | 3,517 |
| December 2024 | 3,321 | 4,316 |
| November 2024 | 4,157 | 5,807 |
| October 2024 | 5,278 | 7,171 |
| September 2024 | 5,490 | 8,192 |
| August 2024 | 6,087 | 9,700 |
Toate the counties
AlbaAradArgeșBacăuBihorBistrița-NăsăudBotoșaniBrăilaBrașovBuzăuCălărașiCaraș-SeverinClujConstanțaCovasnaDâmbovițaDoljGalațiGiurgiuGorjHarghitaHunedoaraIalomițaIașiIlfovMaramureșMehedințiBucharest MunicipalityMureșNeamțOltPrahovaSălajSatu MareSibiuSuceavaTeleormanTimișTulceaVâlceaVasluiVrancea
Source: National Institute of Statistics (INS), matrices TUR104F, TUR105G. Period covered: January 2010 – July 2026. See the source.
The monthly data come from accommodation establishments with a capacity of at least 10 bed-places. From 2021 apartments and rooms to let are covered too, so a month after 2021 does not measure the same basket as one before it. In April and May 2020 some counties have no published figure at all: the chart breaks there, because a gap is not a zero.